

Logistic Regression in Machine Learning
Logistic regression is one of the most reliable and commonly used tools in the large toolbox of supervised machine learning. Many people think it has to do with predicting numerical trends because of its name, but it is actually a key part of logistic regression in machine learning classification. This algorithm doesn't try to guess a range of numbers; instead, it looks at how likely a certain event is to happen.
What is Logistic Regression in Machine Learning?
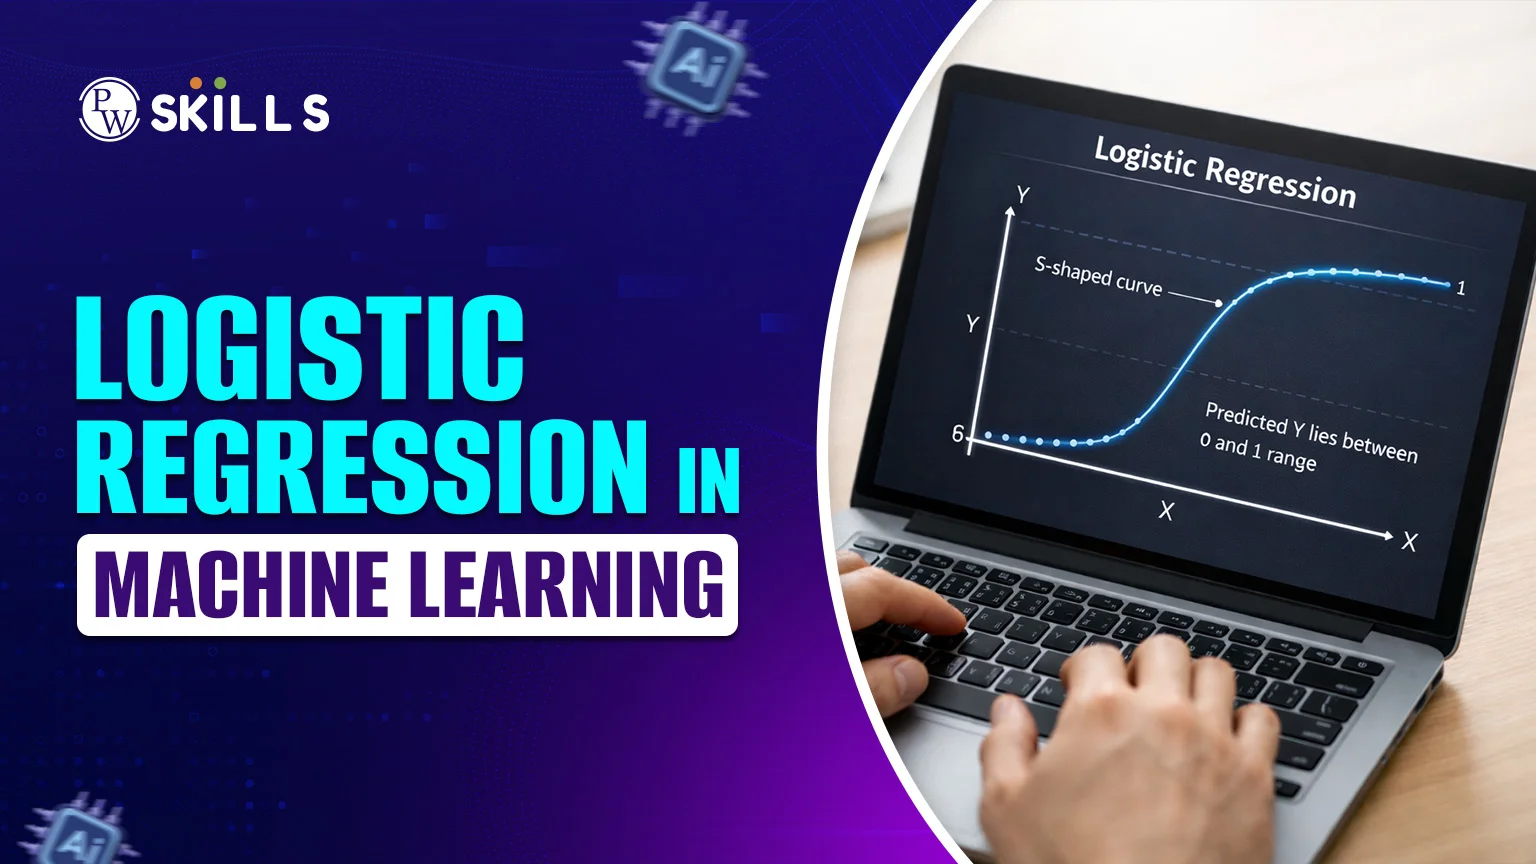
Logistic regression in machine learning is a supervised learning technique used to sort data into specific classes. It is most commonly used for "binary classification", where there are only two possible outcomes. Unlike linear regression, which draws a straight line through data points, a logistic regression in machine learning classification uses a special "S-shaped" curve called the Sigmoid Function. This curve is perfect for probability because it never goes below 0 and never goes above 1.Logistic Regression in Machine Learning Formula
To comprehend the model's decision-making process, we must examine the underlying mathematics. The logistic regression in machine learning formula relies on the logit function. While a linear equation looks like y = mx + c, the logistic model wraps this linear output inside the Sigmoid Function: P(y=1) = \frac{1}{1 + e^{-(mx+c)}}- P: The probability that the output is 1 (e.g., "The customer will buy").
- e: The base of natural logarithms.
- mx+c: The standard linear combination of input features.
Logistic Regression in Machine Learning Terms
To understand the logistic regression in machine learning model, you first need to get comfortable with its unique vocabulary. These terms describe how the model thinks and processes data:- Dependent Variable (Target): The categorical outcome you are trying to predict (e.g., "Success" or "Failure").
- Independent Variables (Features): The inputs or factors that influence the outcome (e.g., "Age", "Salary", or "Credit Score").
- Sigmoid Function: The mathematical "magic" that squashes any numerical value into a range between 0 and 1.
- Odds Ratio: The ratio of the probability of success to the probability of failure ($P / (1-P)$).
- Log-Odds (Logit): The natural logarithm of the odds ratio, which the model uses to create a linear relationship with the input features.
- Threshold: The "decision point" (usually 0.5). If the predicted probability is above this, the model classifies it as 1; if below, it’s 0.
How Logistic Regression in Machine Learning Works?
The logistic regression in machine learning process can be broken down into three logical steps. It’s essentially a linear model that gets a "classification makeover".1. The Linear Combination
First, the model assigns a weight (importance) to each of your input features. It calculates a weighted sum, very similar to linear regression: $z = b0 + b1(x1) + b2(x2) ...$2. The Sigmoid Transformation
This is where the logistic regression in machine learning classification happens. Since $z$ can be any number (like 500 or -100), the model passes it through the Sigmoid Function: $$f(z) = \frac{1}{1 + e^{-z}}$$ This ensures the output is a probability between 0 and 1.3. Making the Decision
Finally, the model compares this probability to a threshold. For a typical logistic regression in machine learning example:- If the probability is 0.7 and the threshold is 0.5, then the model predicts "yes."
- If the probability is 0.3, it predicts "No".
Assumptions of Logistic Regression in Machine Learning
For a logistic regression in machine learning model to work accurately, the data must follow a few specific rules. These logistic regression in machine learning assumptions include:- Binary Output: The dependent variable must be categorical (e.g., Pass/Fail).
- Independence of Observations: The data points should not depend on each other.
- No Multicollinearity: The independent variables (inputs) should not be too highly correlated with one another.
- Large Sample Size: Typically, logistic regression requires a decent amount of data to provide stable results.
- Linearity of Independent Variables and Log Odds: While the relationship between X and Y isn't linear, the relationship between X and the "log odds" of Y should be.
Implementing Logistic Regression in Machine Learning Python
For developers, the logistic regression in machine learning python implementation is straightforward thanks to libraries like Scikit-Learn. The process generally follows these steps:- Import the Library: from sklearn.linear_model import LogisticRegression
- Initialise the Model: Create an instance of the model.
- Fit the Model: Use .fit(X_train, y_train) to let the model learn from your labelled data.
- Predict: Use .predict(X_test) to see how the model handles new data.
How to Evaluate a Logistic Regression in Machine Learning Model?
Once you have built your model using logistic regression in machine learning python, you need to know if it’s actually any good. We use several metrics to measure its performance:- Confusion Matrix: A table that shows the count of True Positives, True Negatives, False Positives, and False Negatives. It’s the "report card" of your model.
- Accuracy: The percentage of total predictions that were correct. While popular, it can be misleading if your data is unbalanced.
- Precision and Recall: Precision tells you how many of your "Yes" predictions were actually correct. Recall tells you how many of the actual "Yes" cases your model managed to find.
- F1-Score: The perfect balance (harmonic mean) between Precision and Recall.
- ROC-AUC Curve: A graph that shows how well the model distinguishes between the two classes. A higher "Area Under the Curve" (AUC) means a better model.
Uses of Logistic Regression in Machine Learning
You likely benefit from this algorithm every single day. Here are some of the most common logistic regression in machine learning use cases:- Healthcare: Predicting whether a patient has a specific disease based on symptoms and test results.
- Finance: Determining the likelihood of a credit card transaction being "fraudulent" or "legitimate".
- Marketing: Estimating the probability that a customer will "churn" (cancel their subscription).
- Email Services: The classic logistic regression in machine learning example is identifying if an incoming email is "Spam" or "Inboxed".


🔥 Trending Blogs
FAQs
Why is it called "Regression" if it's used for classification?
The method's similarity to linear regression is where the term "regression" originates. In order to convert the weighted total of inputs into a probability for classification, an additional step known as the Sigmoid Function is added.
What is a logistic regression in machine learning example?
A great logistic regression in machine learning example is a "Pass/Fail" predictor for an exam. Based on "Hours Studied" (input), the model calculates the probability of passing. If the probability is > 0.5, the student is classified as "Pass."
What is the difference between Linear and Logistic Regression?
Linear regression makes predictions about a value that can change over time, like weight or price, using a straight line. Logistic regression in machine learning classification uses an S-shaped curve to guess a category, like "Yes" or "No."