

Hierarchical Clustering in Machine Learning
One of the most important things for any data scientist to do is figure out how data points naturally clump together. A lot of beginners start with K-Means, but they have a hard time with its major flaw: they have to guess how many clusters there are before they can use it. Hierarchical Clustering in Machine Learning is a game-changer at this point. It makes things more flexible by constructing a framework of clusters that looks like a family tree. In this article, we'll explain how this algorithm works, the numerous kinds that are out there, and how to read the findings using a dendrogram.
What is Hierarchical Clustering in Machine Learning?
It is a kind of learning without supervision that groups data items that don't have labels by how similar they are. The goal is to make sure that points in the same cluster are as similar as feasible, and that points in separate clusters are as diverse as possible. The "hierarchy" is what makes this method unique. It doesn't just provide you a flat list of groups; instead, it makes a multi-level structure where little groups are inside of bigger ones. This is particularly useful when you don't just want to categorise data but also want to understand the relationship between those categories.Key Characteristics:
- No Predefined K: You do not need to specify the number of clusters before starting the process.
- Dendrogram Representation: The results are visualised using a tree-like diagram.
- Flexibility: It can handle various shapes and sizes of data distributions effectively.
Hierarchical Clustering in Machine Learning Types
There are two main strategies for building the cluster hierarchy. You may say that these are "bottom-up" and "top-down" ways of doing things.1. Agglomerative Clustering (Bottom-Up)
This is the most popular type of hierarchical clustering in machine learning algorithm. It starts by looking at each piece of data as its own cluster.- The algorithm finds the two spots that are closest together and combines them into one cluster.
- It does this over and over, merging the next closest clusters until there is only one big cluster with all the data points.
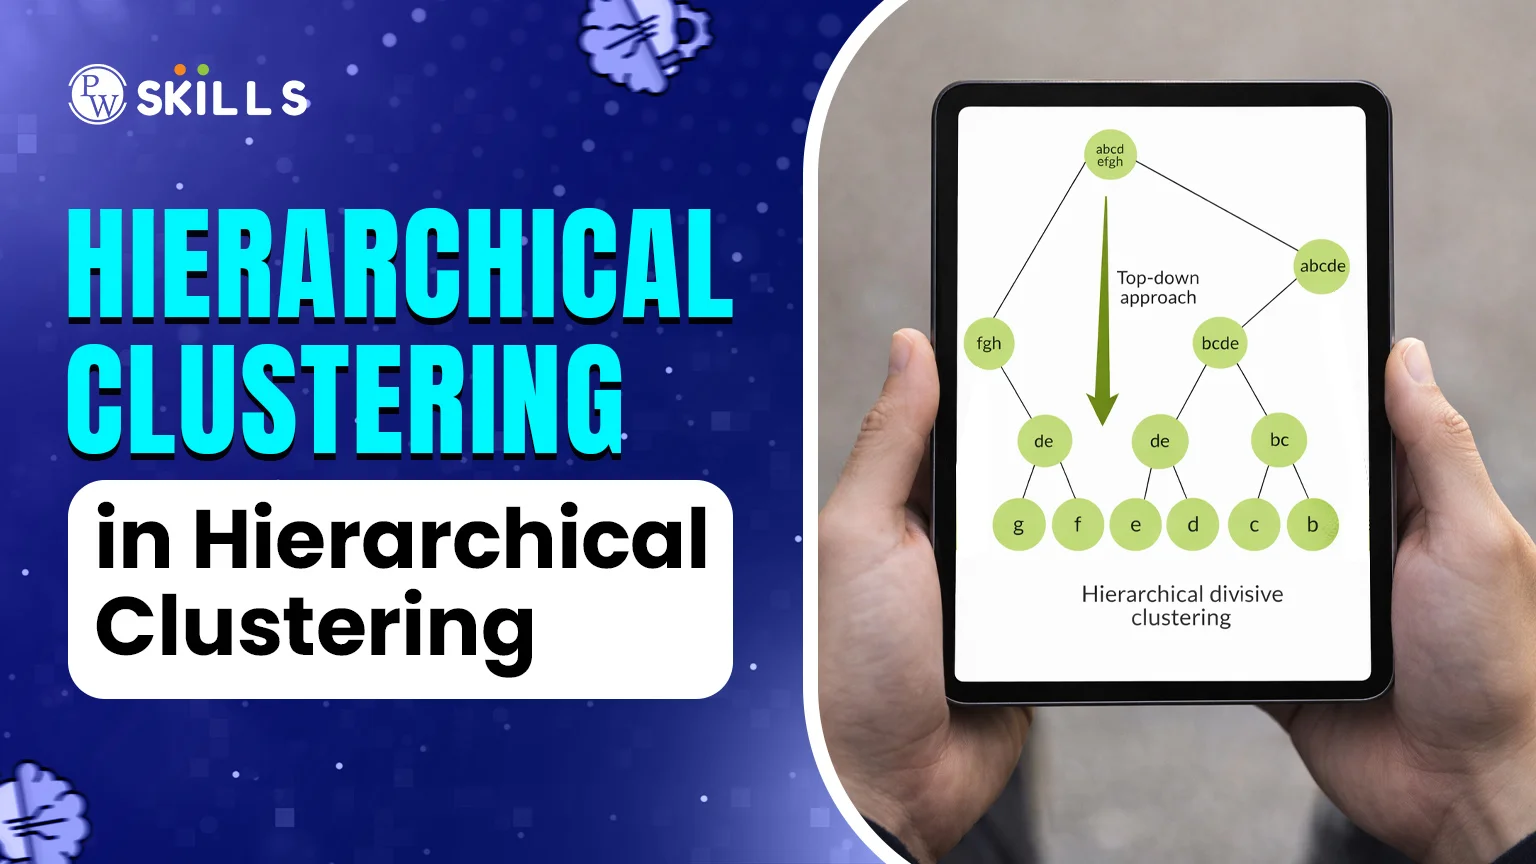
2. Divisive Clustering (Top-Down)
This is the opposite of agglomerative clustering. It starts with one massive cluster that includes all data points.- The algorithm determines the points in the group that are most different from each other and separates them.
- This process of splitting continues until each data point is in its own cluster.
How Hierarchical Clustering in Machine Learning Works ?
To comprehend the hierarchical clustering in machine learning working, it is essential to examine the method of measuring the "closeness" between points. The algorithm goes through a logical flow step by step:- Initialisation: Each data point is given its own cluster.
- Distance Calculation: The technique uses a distance metric (like Euclidean distance) to figure out how far apart all pairs of clusters are.
- Combining: The two clusters that are closest together are combined into one.
- Update Matrix: The distance matrix is changed to show the new distances between the newly formed cluster and the other clusters.
- Repeat: Steps 2 through 4 keep going until there is only one cluster.
Distance Metrics and Linkage
The "linkage" approach decides how to quantify the distance between two clusters:- Single Linkage: The distance between the two clusters' closest points.
- Complete Linkage: The distance between the two clusters' furthest distant locations.
- Average Linkage: The average distance between all pairs of points in two clusters.
- Ward’s Method: Minimises the variance within the clusters being merged.
Dendrogram in Hierarchical Clustering in Machine Learning
One of the biggest advantages of this model is the hierarchical clustering in machine learning dendrogram. A dendrogram is a diagram that records the sequences of merges or splits.- The X-axis usually represents the individual data points or clusters.
- The Y-axis represents the distance (or dissimilarity) between the clusters.
- The Height of the Horizontal Lines tells you how far apart the merged clusters were. The taller the vertical line, the more different the clusters are.
Hierarchical Clustering in Machine Learning vs. K-Means
To choose the right hierarchical clustering in machine learning model, it helps to see how it stacks up against the industry standard, K-Means.| Feature | K-Means Clustering | Hierarchical Clustering |
| Number of Clusters | Must be specified at the start (K). | Determined after looking at the dendrogram. |
| Complexity | More efficient for large datasets (Linear). | Computationally expensive for large data. |
| Visualisation | Difficult to visualise hierarchy. | Excellent visualisation via dendrograms. |
| Stability | Results can change with different starting points. | Results are reproducible and stable. |
| Shape | Best for spherical clusters. | Can handle various shapes depending on linkage. |
Hierarchical Clustering in Machine Learning Example
Let's look at a real-life example. Think of a store that wants to group its customers by how much they spend and how old they are.- Data: Each customer is a dot on a graph.
- Step 1: The algorithm detects two clients, both of whom are 25 years old and spend £500 a month. It puts them together.
- Step 2: It identifies another 26-year-old consumer who spends £480. It combines them into the first group.
- Conclusion: The corporation might notice three separate branches on the dendrogram: "Young High-Spenders," "Middle-Aged Moderate Spenders," and "Retirees." The business can then "cut" the dendrogram at the height that makes these three groups.
Applications of Hierarchical Clustering in Machine Learning
Hierarchical clustering is widely used across industries where understanding relationships within data is important. Some common applications include:- Customer Segmentation: Grouping customers based on purchasing behaviour, demographics, or preferences.
- Document Clustering: Organising articles, blogs, or research papers into meaningful topics.
- Image Segmentation: Grouping similar pixels to identify objects in images.
- Bioinformatics: Analysing gene expression data to identify similarities between biological samples.
- Fraud Detection: Identifying unusual patterns or anomalies in financial transactions.
Hierarchical Clustering in Machine Learning Python
When using Python, the most popular libraries are Scikit-learn and SciPy.- SciPy is excellent for generating and plotting dendrograms using the linkage and dendrogram functions.
- Scikit-learn offers the AgglomerativeClustering class, which is perfect for fitting the model into a standard machine learning pipeline.
Advantages and Disadvantages of Hierarchical Clustering in Machine Learning
Benefits:
- You get a visual representation of the data structure.
- The hierarchy provides more information than a simple flat label.
- It is very helpful for small to medium-sized datasets where relationships are nuanced.
Limitations:
- Scalability: Because it calculates distances between all points, it becomes very slow as the dataset grows (it has a time complexity of O(n³)).
- Irreversible: Once two clusters are merged, they cannot be unmerged later in the process.
- Sensitivity: It can be sensitive to outliers, which might form their own tiny clusters or distort distances.
When to Use Hierarchical Clustering in Machine Learning?
Hierarchical Clustering remains a vital tool for data scientists who need to explore the underlying structure of their data without making assumptions about cluster counts. By leveraging different linkage methods and interpreting the dendrogram, you can uncover patterns that flatter algorithms might miss. While it may not be the fastest choice for "big data", its precision and interpretability make it indispensable for detailed statistical analysis. Also Read - Types of Agents in AI Types of AI Based on Capabilities AI in Transportation Backtracking Search Explained for AI Types of AI Based on Functionality


🔥 Trending Blogs
FAQs
What is the main benefit of hierarchical clustering in ML?
The primary benefit is that it does not require the user to pre-specify the number of clusters. It also provides a visual dendrogram that helps understand the hierarchical relationships within the data.
How do you choose the number of clusters in a hierarchical clustering machine learning model?
You choose the number of clusters by observing the dendrogram and identifying the largest vertical distance that doesn't intersect any horizontal clusters. Cutting the tree at this point yields the most natural groupings.
When should I use hierarchical clustering algorithm instead of K-Means?
You should use it when you have a small- to medium-sized dataset and you need to understand the relationship between clusters, or when you don't know the optimal number of clusters beforehand.
What is the difference between Agglomerative and Divisive hierarchical clustering?
Agglomerative is a "bottom-up" method in which individual points come together to form clusters. Divisive is a "top-down" approach where one large cluster is repeatedly split into smaller ones.
Which library is best for hierarchical clustering in Python for machine learning?
Scikit-learn is the greatest tool for beginners to use to build models, whereas SciPy is better for making intricate dendrogram visualisations. Both are common tools in the world of Python data science.