

How Monitoring & incident response From DevOps and Cloud Computing Course Applies on the Job
 Hardik Gupta17 Jul, 2026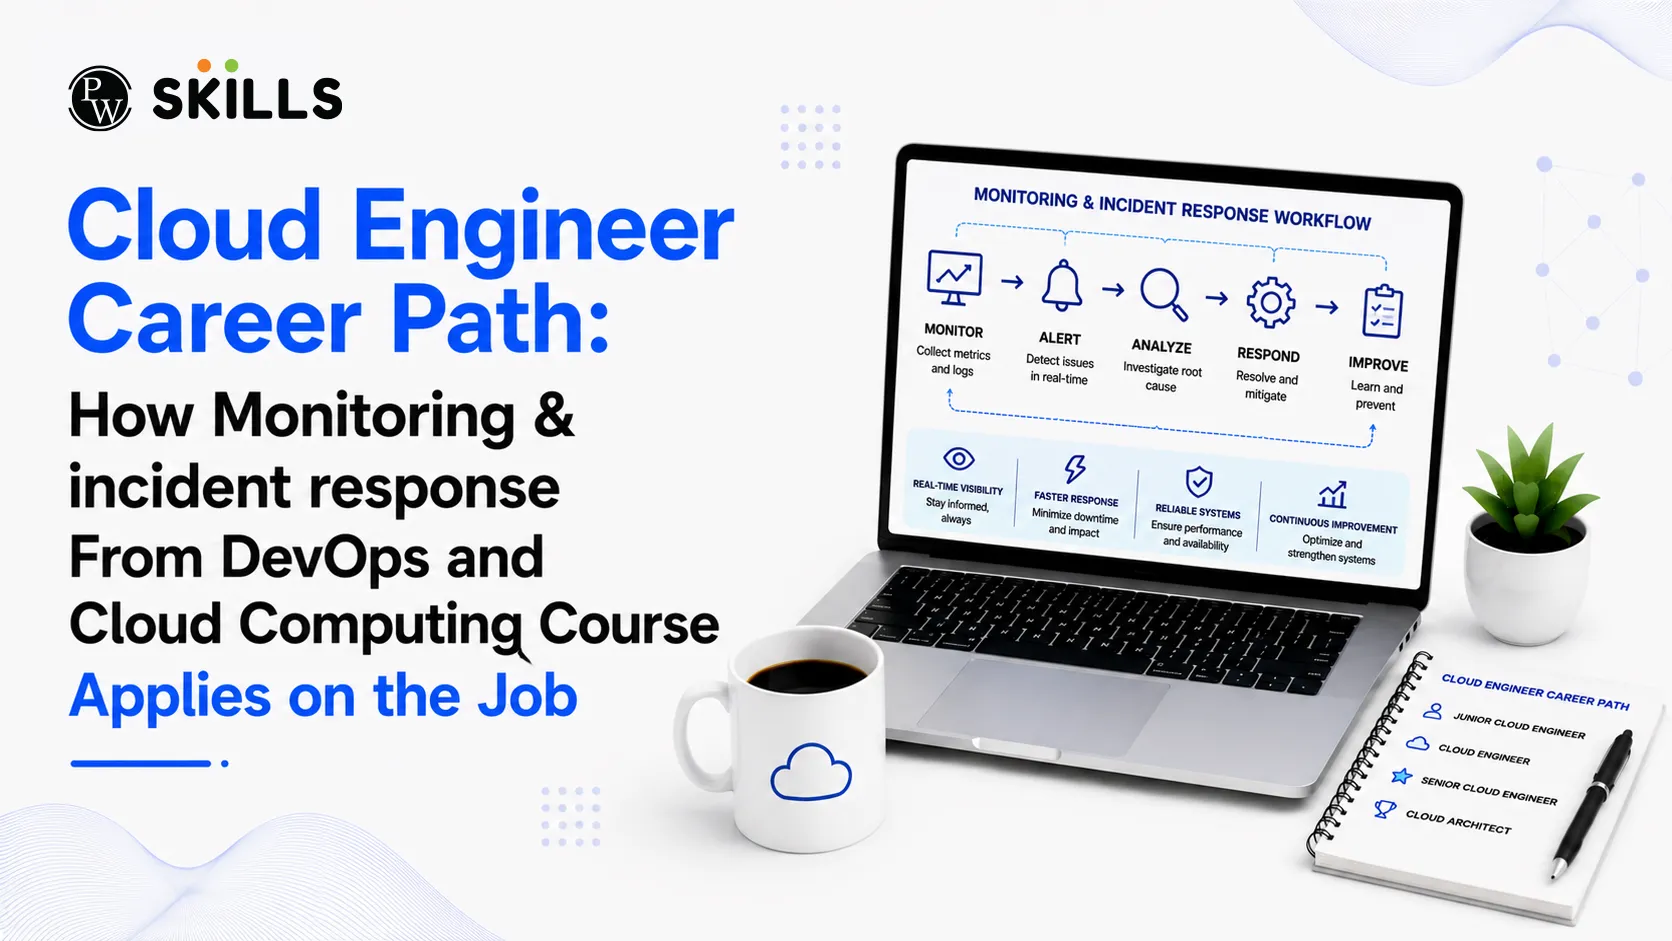
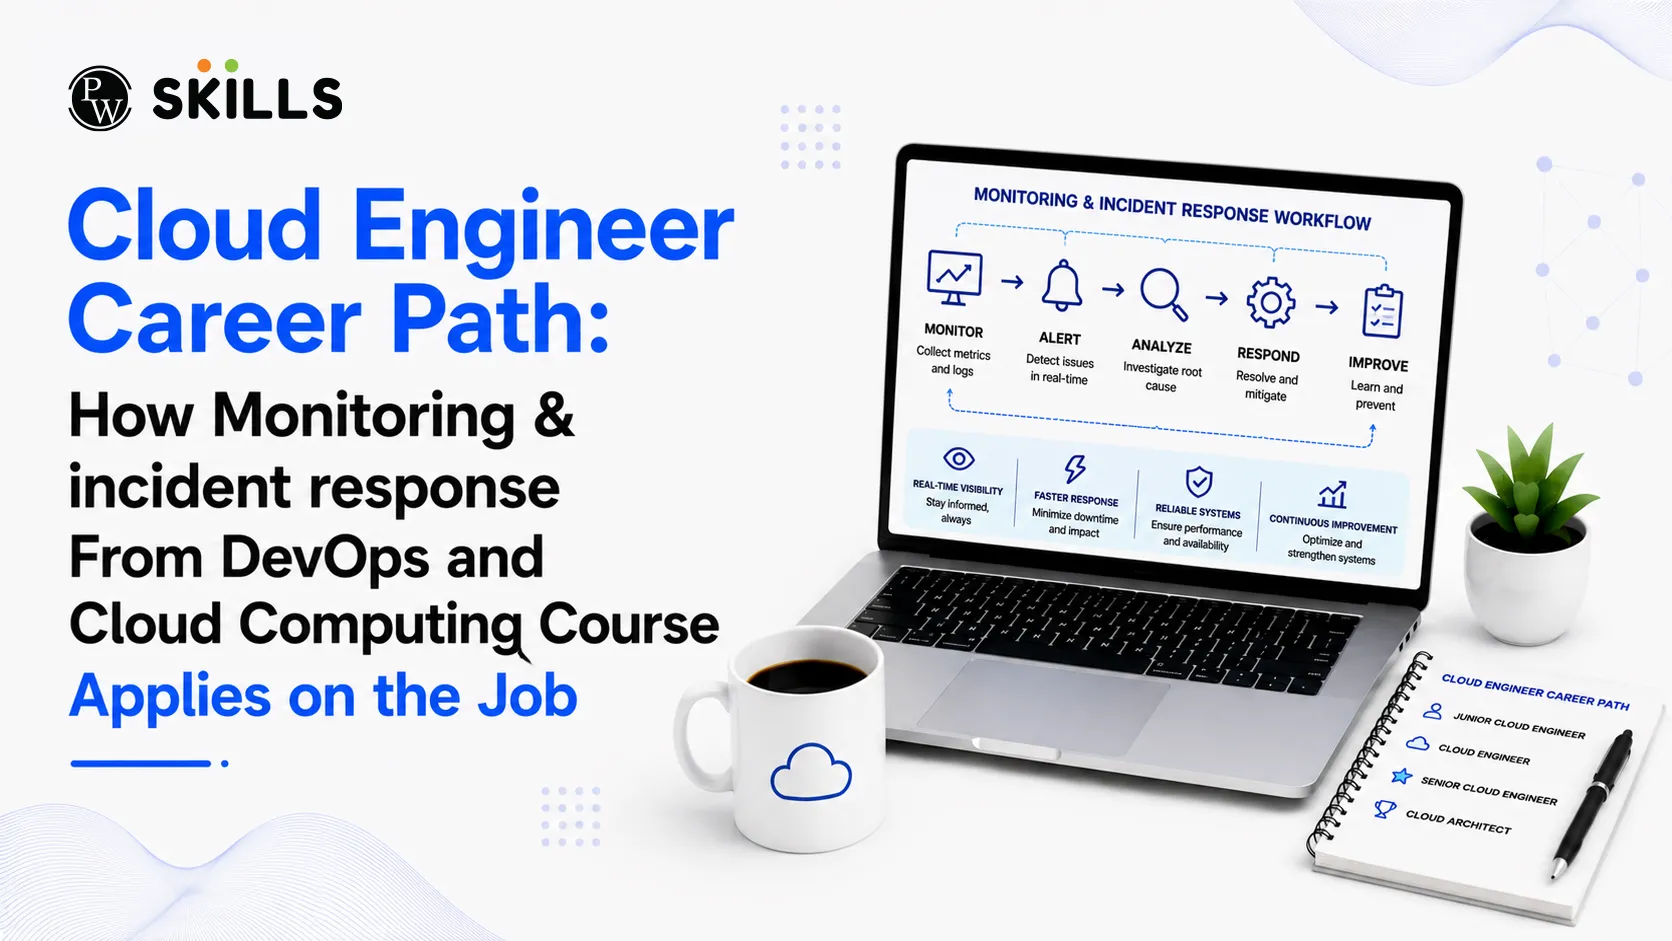
Keeping massive digital platforms online requires continuous vigilance. When a sudden crash happens, cloud engineers must resolve the issue within minutes to protect business operations.
Gaining hands-on experience through a comprehensive DevOps and Cloud Computing Course bridges the gap between theoretical knowledge and the high-pressure demands of real-world infrastructure management.
Overview of DevOps and Cloud Computing Course
A DevOps and Cloud Computing Course is designed to prepare learners for modern infrastructure and cloud operations by combining software development practices with cloud platform management. The course focuses on essential areas such as cloud deployment, CI/CD pipelines, infrastructure automation, monitoring, incident response, and system reliability.
Through practical projects and real-world scenarios, students learn how to deploy applications, monitor production environments, troubleshoot failures, and maintain highly available systems. These hands-on skills help aspiring professionals transition confidently into Cloud Engineer, DevOps Engineer, and Site Reliability Engineering roles across industries.
What is the Importance of Monitoring Skills in DevOps and Cloud Computing Course?
Modern cloud infrastructure relies heavily on automated tracking systems to maintain health and performance across vast networks. In modern DevOps and Cloud Computing Course + Cloud Engineer Jobs, engineering teams use specialized tools to observe resource utilization, network traffic, and application behavior across distributed systems.
Continuous monitoring acts as the nervous system of any cloud environment. Without deep visibility into virtual machines, containers, and serverless clusters, infrastructure teams operate blindly, leaving systems vulnerable to performance drops.
Effective observability relies on collecting specific types of data to form a complete picture of operational health:
-
Metrics: Metrics are numerical measurements collected continuously over time to help cloud engineers understand the health and performance of infrastructure components. They track critical indicators such as CPU utilization, memory consumption, disk usage, input and output operations, network bandwidth, request rates, and application response times. By analyzing these values, teams can identify performance bottlenecks, predict capacity requirements, and trigger automated scaling actions before service quality is affected.
-
Logs: Logs are time-stamped records generated by applications, operating systems, containers, databases, and networking components during normal operations. They provide detailed information about user actions, configuration changes, authentication events, warnings, exceptions, and system failures. Engineers rely on logs to investigate incidents, perform root cause analysis, audit system behavior, and understand exactly what happened before, during, and after an outage or deployment issue.
-
Traces: Traces capture the complete journey of a request as it travels across multiple services, APIs, databases, and microservices within a distributed cloud environment. They help engineers visualize dependencies between components, identify latency bottlenecks, pinpoint failing services, and understand how delays in one system affect the overall application experience for end users..
|
Observability Component |
Description |
|
Metrics |
Numeric values that measure resource usage and system performance. |
|
Logs |
Time-stamped records of system events and application activity. |
|
Traces |
End-to-end tracking of requests as they move through different services. |
How Incident Response From a DevOps and Cloud Computing Course Works During Cloud Deployment?
Deploying new software updates to production environments often introduces unexpected variables and configuration errors. During critical phases of DevOps and Cloud Computing Course + Cloud deployment, incident response frameworks provide a structured methodology for identifying, isolating, and fixing code errors quickly.
Unplanned downtime can cost organizations thousands of pounds per minute in lost revenue and damaged user trust. A disciplined incident response strategy ensures that operations teams can quickly roll back problematic updates or patch security vulnerabilities without causing prolonged service outages.
|
Stage |
Purpose |
|
Detection |
Identify an incident through alerts, monitoring, or user reports. |
|
Triaging |
Assess the incident, determine its severity, and prioritize the response. |
|
Remediation |
Resolve the issue by applying fixes, restoring services, or mitigating the impact. |
|
Post-Mortem |
Review the incident, identify the root cause, and document lessons learned to prevent future occurrences. |
The incident management cycle follows a strict sequence of operational phases designed to restore services efficiently:
-
Detection: Automated alerts trigger notifications based on pre-defined performance anomalies.
-
Triaging: On-call engineers assess the severity of the issue and assign priority levels based on business impact.
-
Remediation: Teams apply hotfixes, restart services, or roll back deployments to stabilize the live environment.
-
Post-Mortem: Engineers document the root cause of the failure to prevent similar issues from happening again.
How does a DevOps and Cloud Computing Course Teach Production Environment Management?
Enrolling in a structured DevOps and Cloud Computing Course + how you learn to handle live infrastructure, defines your success as an engineer. Training programs simulate real-world system failures, teaching professionals how to configure alert thresholds, interpret log files, and build robust dashboards.
Practical education teaches you how to automate repetitive maintenance tasks, leaving more time for architectural improvements. Understanding the relationship between active system telemetry and automated scaling policies allows engineers to build highly resilient platforms that adjust automatically to traffic spikes.
|
Stage |
Purpose |
|
System Telemetry |
Collect metrics, logs, and traces from applications and infrastructure. |
|
Alert Threshold |
Monitor telemetry data and trigger alerts when predefined thresholds are exceeded. |
|
Auto-Scaling |
Automatically add or remove computing resources based on demand and system performance. |
What Best Practices Are Covered in a DevOps and Cloud Computing Course?
Setting up effective alerting mechanisms requires a careful balance between broad system visibility and operational focus to prevent engineering teams from becoming overwhelmed. Poorly configured monitoring rules often create alert fatigue, a situation where teams receive such a high volume of notifications that important warnings become difficult to identify.
Over time, this can reduce response speed and increase the risk of critical production incidents being missed during high-pressure situations.
To maintain strong operational standards, infrastructure alerts should focus on actionable symptoms rather than temporary fluctuations or abstract system conditions. For example, alerting on elevated application error rates, failed deployments, or service downtime provides immediate operational value because engineers can act on these signals quickly.
In contrast, generating alerts for short-lived CPU spikes or minor memory fluctuations often creates unnecessary noise without improving system reliability.
Consider these core principles when building effective alert strategies for production environments:
-
Actionability: Every notification should point to a specific issue and include a clear, documented action that an engineer can execute immediately to restore service health.
-
Severity Levels: Classify alerts into multiple priority tiers, such as informational warnings, medium-priority operational alerts, and critical incidents that require immediate intervention from on-call teams.
-
Dynamic Thresholds: Use historical performance baselines and traffic patterns instead of static numbers to reduce false positives during predictable demand spikes.
-
Alert Ownership: Assign alerts to specific teams or individuals to ensure accountability and faster resolution during incidents.
-
Continuous Review: Regularly audit alert rules and remove outdated notifications to keep monitoring systems relevant and effective as infrastructure evolves..




FAQs
What is the role of monitoring in cloud environments?
How does incident response improve software deployments?
Why is alert fatigue a risk for cloud engineering teams?
What data forms the foundation of modern observability?
How does a DevOps and Cloud Computing Course prepare you for production support?





Get Free Counselling Today
and Clear up all your Doubts
 Live & recorded classes available at easeDashboard for progress trackingLakhs of practice questions

