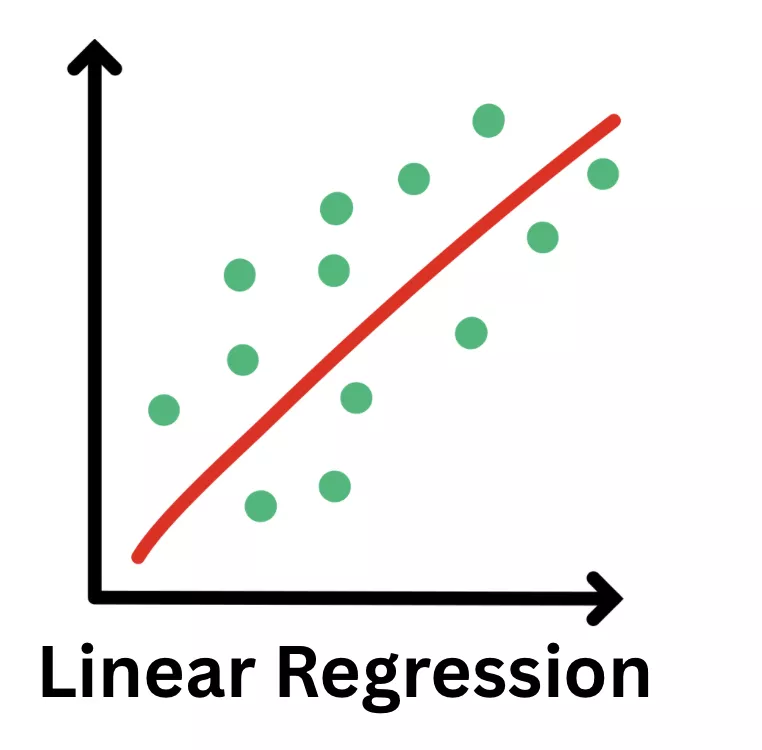
The term linear in Linear regression depicts that a model is trying to learn between input variables and output variables. The regression is used when you are trying to find a relationship between a set of variables. Linear regression is a method of finding a relationship within an already available set of data.
Every data analyst their early phase begins with linear regression. Simply, linear regression is the change in output proportional to the change in input. Here, we will learn everything a beginner needs to know about simple regression.
What Is Linear Regression?
Linear regression is a data analysis approach that is used to predict the outcome of unknown data using other related data from the dataset, which is known. Basically, simple regression models the dependent and independent variables as a linear equation.

For instance, you want to build your budget for the next month and have an expense record for the last 12 months. You can use this (Known) data to determine the expenses in your next month (unknown), and manage them accordingly i,e. Cutting back on leisure or things that you can let go of for some time.
Linear Regression: Key Highlights
- Linear learning in machine learning is used to find a relationship between variables i,e. Feature and label.
- Mathematically, this regression technique marks the linear change in output proportional to the change in the input.
- Linear regression helps predict how each feature change affects the output.
- In statistics and machine learning, linear regression is used to find the outcome of an event.
- Slope and intercept are two major elements of a linear graph.
Why Is Linear Regression Important?
Linear regression is a very simple, basic model used frequently in statistics and computing, as it provides an easy-to-interpret and mathematical formula for getting simple predictions based on known data and variables.
- This simple regression forms the foundation for many advanced models, including machine learning, Neural networks, Ridge, Lasso, GLMs, optimization, and more.
- Organisations use this linear regression technique to get crucial insights and predict future trends.
- The simple regression gives you clear and easy-to-understand insights.
- Raw data is available with industries in large quantities, which can be converted into business intelligence and actionable insights.
- It is used by data science experts in many fields to conduct tests based on environmental data, behavioral data, and more to predict future trends.
- Advanced Artificial intelligence and machine learning use linear regression to solve complex problems.
- It helps in predicting, trend analysis, risk assessment, and more.
- You can use the linear regression technique for performing specific linear regression in Python, Excel linear regression, R linear regression, MATLAB linear regression, Sklearn linear regression, and more.
Read More: Python in Data Science History, Scope, Advantage
How Does Linear Regression Work?

Linear Regression is a simple technique used to determine an outcome based on the available data. It is a graph between two variables, say x and y. There are two types of variables in simple regression, namely
- Independent variable or explanatory variable
- Dependent variable or response variables
The independent variable is plotted along the horizontal axis, and the dependent variable y is plotted on the vertical axis of the graph.
Read More: Linear Algebra in Data Science: Applications and Significance
Mathematical Representation of Regression Graph
Let us understand regression more precisely with a linear graph plotted using the two variables x and y.
| y = mx + c , x, y E R |
Here, m and c are the constants for all possible values of x and y. We can plot a graph by taking different values for x and y.
- Take some data from the input dataset for x and y accordingly.
- Plot a straight line and measure the correlation between different values of x and y.
- You can keep changing the values and get the straight line character from the linear slope.
- When you have the slope value i,e. m then you can use it to find other values fitting for the graph.
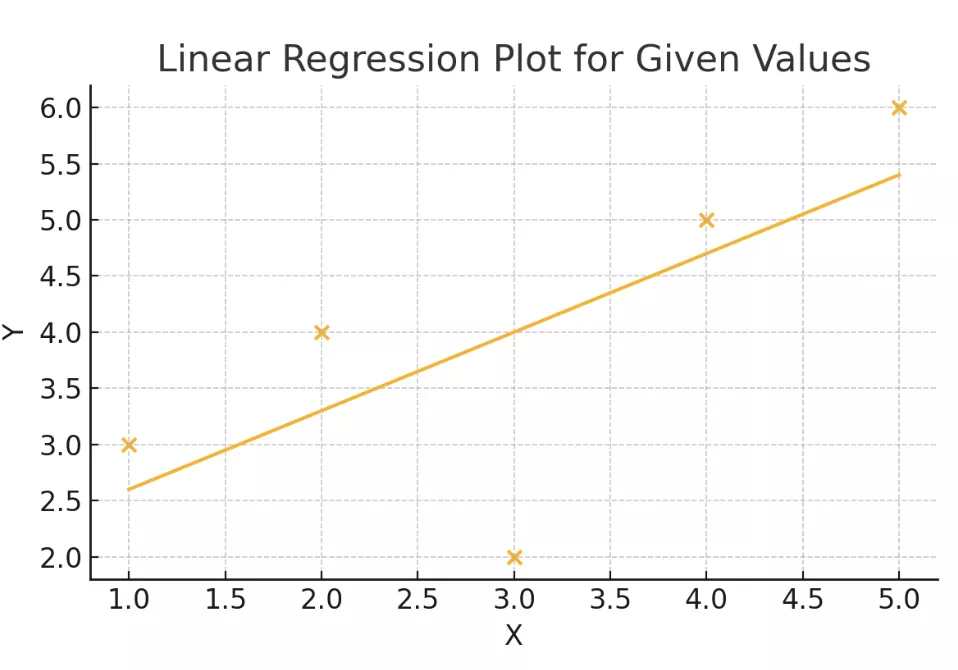
Let us take an example for the following values of x and y below.
| x | y |
| 1 | 3 |
| 2 | 4 |
| 3 | 2 |
| 4 | 5 |
| 5 | 6 |
You can use these values to get the best straight line of the form for y = mx+ c.
 |
Points to Take Care When Plotting Linear Regression
Before you start building your simple regression graph, you must make sure that the data you are using fulfills certain criteria of standards to get you the best and most accurate output.
- The observations you are making must be independent of each other.
- Make sure data contains no outliers.
- The variables must be measured at a continuous level.
- You can use a scatterplot to find a quick linear relationship between the given two variables.
- Make sure you always go for the scatter points first, as they show the actual data.
- Labels must be done carefully, and make sure they are readable. Keep the x-axis for the independent variable (horizontal) and the y-axis for the dependent variable.
- Never forget to name your graph with a title to describe clearly what the linear graph actually represents.
- Do not reach conclusions with only a handful of data points; take enough data points to get the true relationship between variables.
What Is Intercept and Slope In Linear Regression?
The intercept and slope an important elements of simple rectilinear regression. Let us know about them in detail.
| Intercept is the value of y when the x value equals 0 |
- The intercept is a condition in a linear regression where the regression line crosses the y-axis. It represents the value of the dependent variable where the independent or known variable becomes zero. The intercept value, however, cannot always give the exact value or be calculated.
- The slope variable in this regression is used to represent the extent to which the dependent variable might change on a unit increase in the independent variable.
- A positive slope indicates a positive relationship, while a negative slope on the linear regression graph indicates a negative relationship.
In the linear regression equation, y=mx + c, the m represents the slope,
- When m is positive, y increases as x increases
- When m is negative, y decreases as x increases
- When m is zero, there is no connection or relationship between these two variables.
In this equation, can you tell when the value of x (independent variable) gets 0, the value of y comes to be c i,e. Intercept. The intercept tells where the line of regression starts on the y-axis.
Read More: 6 Most-In-Demand Predictive Data Science Models in 2025
Example of Linear Regression Based on the Real World
Linear regression is an important asset when it comes to predicting and extracting crucial insights from the raw data available. For instance, let us take an example.
When you need to predict house prices based on features like square footage (sq. ft). This can easily be carried out using linear graph, as there is a strong relationship between the area and price, because when the area increases, the price also increases. In this case, we are only taking two variables.
- Area (x) – Independent variable
- Price (₹) – Dependent variable.
| Price = m X Area + c |
You can use the area value to calculate the price of a plot easily, and you will see a perfect relationship linearly between these too. Let us take some data for reference, check in the table below.
| Area (sq ft) | Price (₹ Lakhs) |
| 800 | 45 |
| 1000 | 55 |
| 1200 | 68 |
| 1500 | 85 |
| 1800 | 102 |
Now, there are similar examples for simple regression in linear manner. Let us get a glimpse of some.
- You can use this regression to evaluate trends and sales estimates.
- This regression techniques are also used to analyze risk in insurance companies.
- You can use regression to analyze pricing flexibility and its effect on customer behavior.
Read More: Top 60+ Data science Interview Questions and Answer
Learn Data Science with PW Skills
Gain proficiency in Data Science with generative AI in this all-in-one 6-month online program provided by PW Skills. In this Data Science Course, you will get in-depth tutorials covering every fundamental, tool, and technology important to make you job-ready.
Learn in the presence of dedicated mentors, get industry-led live sessions, and record lecture videos. Practice exercises, module level assignments, and capstone projects are the main highlights of this course. Hurry! enroll now and get your data science certification only at pwskills.com
Linear Regression In Data Analytics FAQs
Q1. What is a Perceptron?
Ans: A perceptron is a foundational unit in a neural network consisting of a single layer of output nodes connected to several input networks using a non-linear function to determine or predict the output using the weighted connections and a bias.
Q2. Who invented the Perceptron?
Ans: The Perceptron was invented by Frank Rosenblatt in the 1950s. It is one of the earliest models of artificial neural networks, forming the foundation of neural networks, deep learning, and advanced artificial intelligence.
Q3. What are the types of perceptrons?
Ans: There are two major types of Perceptron, namely single-layer perceptron and Multi-layer Perceptron.
Q4. What are the weights in Perceptron?
Ans: The weights in the Perceptron signify the strength of each input node. It represents the effect of each node in the Perceptron.

