

R Programming for Data Science: Effective Guide (2025)
R Programming for Data Science focuses on using the R language for data analysis, visualization, and statistical modeling. It helps data scientists clean, explore, and interpret data efficiently using libraries like ggplot2, dplyr, and tidyr.

R programming for Data Science is an important programming language to learn for beginners and professionals, so that one can survive in today's data dominated world. R programming is the open-source programming language provides a comprehensive setup for statistical analysis and graphics. Hence, it is the preferred tool worldwide for statisticians, researchers, and data scientists. Whether it is to work with a complex dataset or build predictive models, R programming for Data Science has that specialized tool for transforming raw data into intelligence. If you're looking for detailed notes on data science using R programming notes, this comprehensive article is a great starting point.
What is R Programming?
R programming is both the programming language and a software environment for statistical computing and graphics. It is a GNU project, with R being free software, and hence, it is made available to the students, researchers, and professionals anywhere in the world. Below points shows why to choose R for data science:- Open Source: R is completely free and open source with active community members.
- Extensible: R offers different statistical and graphical techniques.
- Compatible: R is favourable across all the platforms- Linux, Windows, Mac.
- Library: R has an various library of packages for Machine Learning.
- Easy Integration: R can be integrated with softwares like Tableau, SQL server with ease.
- R for non-coders: Non-coders can also understand and perform programming in R as it is easy to understand.
 R is more than just a programming language supported by Comprehensive R Archive Network (CRAN) and it has a worldwide repository system.
History of R Programming
The history of R can be traced back to the S programming language, which was developed by the Bell Laboratories in the 1970s. R pogramming was written by Robert Gentleman and Ross Ihaka at the Auckland University in New Zealand. Lets explore more about the timeline.- 1993: The first project started
- 1995: R was released as a free software under the GNU General Public License.
- 1997: The R Core Team was formed to manage the language's development; the Comprehensive R Archive Network (CRAN) was born, being the main repository of R software and its ever-growing bunch of packages.
- 2000: Version 1.0.0 was released.
Companies Using R
With more and more companies focusing on generating insights from data a significant growth has been noticed in R programming over the years some of the top companies using R include:- Amazon
- IBM
- Oracle
- Firefox
R for Data Science
Statistical analysis is what R was fundamentally designed for, which is why it is a key foundation for many data science workflows. It is useful in situations that demand deep statistical expertise and publication-standard visualizations.Key Use Cases: R Programming for Data Science
- Exploratory Data Analysis (EDA): R's strengths are its wide ranging statistical functions. Functions makes it ideal for the investigation of data to detect patterns, observe outliers, and formulate hypotheses.
- Statistical Modeling: R supports every category of contemporary statistical methods, from basic regression models to advanced hierarchical models.
- Data Visualization: Outstanding customizable statistical graphics are produced by packages like ggplot2.
- Machine Learning (ML): ML research and model development are the focus areas for R with its very different packages - caret and tidymodels.
- Reproducible Research: Tools like R Markdown let you combine R code, its results, and text to create a neat consolidated document or report, guaranteeing that others can easily reproduce your analysis.
When to Choose Python vs R programming for Data Science
If statistics, data visualization, and research are all you want to work about, R programming for Data Science is the language to use. It shines when you’re working with structured datasets, running complex statistical tests, or creating polished visual reports for analysis. Python is on other hand, is most suitable alternative if you have to deal with data cleaning, exploratory data analysis, machine learning, deep learning, and production deployment of data products. This is mainly because of its flexibility, which also makes it the first choice for tech companies and startups.- Use R for analysis-oriented and research-oriented work.
- Use Python for production and AI-related work.
| Feature/Aspect | R Programming | Python Programming |
| Ease of Learning | Designed for statisticians; syntax can feel tricky for beginners | General-purpose language; simple and beginner-friendly syntax |
| Primary Strength | Strong in statistics, data visualization, and exploratory analysis | Strong in machine learning, deep learning, and integration with production systems |
| Community & Support | Huge academic and research community; widely used in universities | Larger global developer community; widely used in industry and tech companies |
| Libraries for Data Science | ggplot2, dplyr, tidyr, caret, randomForest | pandas, numpy, scikit-learn, matplotlib, tensorflow, pytorch |
| Visualization | Very powerful; ggplot2 is industry favorite for plots | Good, but less intuitive; matplotlib and seaborn widely used |
| Statistical Analysis | Built specifically for advanced statistics | Possible, but requires extra libraries |
| Machine Learning & AI | Supports ML via packages but limited compared to Python | Industry standard for AI/ML with rich ecosystem |
| Speed & Performance | Slower for large-scale tasks | Faster and more scalable for big data and production |
| Industry Adoption | Popular in academia, healthcare, and research | Popular in tech, startups, finance, and large-scale enterprise systems |
| Learning Curve | Steeper for non-statisticians | Easier for beginners and versatile across domains |
Environment in R Programming
The R environment is an complete and integrated package of software facilities for data manipulation, calculation, and graphical display. Most common and feature-rich among them is RStudio.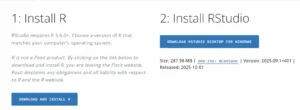 IDE in RStudio has:
- Source Editor: Write and edit your R scripts and R Markdown documents.
- Console: Executes R commands and shows results in a textual form.
- Environment: This opens all the objects (variables, data frames, functions) currently available in the memory of R.
- History: A record of all commands executed in the console.
- Plots: Where the generated data visualizations are displayed.
- Packages: Installed packages are listed, and it allows you to load and unload them.
- Help: The gateway to the rich bibliography of R where all functions are described in detail.
R Programming for Data Science: Examples
A simple R programming for Data Scienceexample demonstrates its vectorized nature and focus on statistics.Example: Calculating Statistics and Creating a Plot
- Create a Vector (a basic data structure in R)
- Calculate Basic Statistics
- Use the powerful ggplot2 package for a Histogram
Applications: Learning R Programming for Data Science
R is usually recognized as having powerful analytical capacity without its scope ranging:- Finance: Quantitative analysis, algorithmic trading, risk management, and credit scoring.
- Health/Pharma: Biostatistics, clinical-trial data analysis, and genomics research.
- Academia and Research: Statistical modeling, hypothesis testing, and publishing reproducible research.
- Marketing: Customer segmentation, churn prediction, and social media analysis.
- Business Intelligence (BI): Creating dashboards and reporting systems using applications such as Shiny for the communication of insights from complex data.
Advantages and Disadvantages of R Programming in Data Science
R has always been popular among data scientists, especially statisticians and researchers. Being a tool, it has its own strengths and weaknesses. Understanding those might help you get an idea of whether R is the tool for your data projects.| Aspect | Advantages of R | Disadvantages of R |
| Statistical Power | Built specifically for statistics and data analysis; rich statistical functions | Limited general-purpose programming capabilities compared to Python |
| Visualization | Industry-leading visualization libraries like ggplot2 and lattice | Visualization can become slow with very large datasets |
| Data Handling | Great for structured data, survey analysis, and reporting | Struggles with massive unstructured data or streaming data |
| Community Support | Strong academic and research community; thousands of specialized packages on CRAN | Less support for production-grade applications and deployment |
| Learning Curve | Easy for statisticians and data analysts with math background | Steeper learning curve for those without prior stats knowledge |
| Integration | Works well with tools like RMarkdown, Shiny, and visualization dashboards | Weaker integration with enterprise tools and web applications |
| Machine Learning | Provides ML libraries (caret, randomForest) suitable for prototyping | Lacks the breadth and performance of Python’s ML/AI ecosystem |
| Cost & Accessibility | Open-source and free; highly accessible for academic users | Requires optimization for handling big data efficiently |
R Programming For Data Science Reddit: A Developer's Overview
To give you a real-world view on R for Data Science, here's what one experienced developer says about R's best parts. Why R programming for Data Science Wins?- Best for Serious Statistics: When pure statistics or research hypothesis testing need to be performed, R is enough.
- Stunning Data Pictures: ggplot2 belongs to R and is considered the best tool to produce beautiful layered and complicated charts. It is usually much easier and quicker to get a good picture with it than through any of the alternatives in Python.
- Easy Interactive Dashboards: Want to make an interactive web dashboard layout for the data? Shiny (tool) is one to use. Developers tend to find it more complete and ready to use against related tools in Python.
What's Next?
R programming for Data Science is specialized and robust that it's not just another language, it is must have skill in the world of data science. If you are ready to move beyond the basic of statistical insights, now is the time to dive into the details more technically. Join us in furthering your study of R programming for Data Science by going into a deeper analysis of some of the key concepts and advanced techniques for your complete R for Data Science Notes.Master Data Science with PW Skills
Are you ready to experience the full potential of R programming for Data Science? While this article introduced R as the statistical computing and visualization tool, comprehensive practice will make a difference here. Enroll in the Data Science PW Skills Course and gain very practical data science using R programming notes, for R Programming for Data Science. Become an expert in advanced statistical modeling, and start on your journey into becoming a certified data scientist today. Learn R Programming for Data Science the right way.


FAQs
Is R programming good for data science?
Yes, R is excellent for data science, especially for statistical analysis, data visualization, and academic research.
What are the main advantages of R in data science?
R offers the most abudant functions for statistics, features advanced visualization libraries such as ggplot2, and has a dozen strong academic community support.
What are R programming disadvantages?
R has problems with extremely large data and has limited machine learning features when compared to Python. Its use in production is poor.
Should I learn R or Python for data science first?
If research is your focus, R is a good starting point. If you're more interested in machine learning, AI, or general industry applications, then Python is usually the better choice to start with.