

A Day in the Life of a Data Analyst Working on Swiggy-Style Dashboards

The moment you place an online meal order, thousands of events trigger behind the scenes. As a student, future analyst, or aspiring data professional, the mystery often lies in how information translates into business decisions. Most learners have challenges connecting what they have learnt about Excel spreadsheets in theory to building a data analyst dashboard project.
This article explores the thrilling realm of delivering results amidst high expectations. We will investigate how experts handle large datasets and what tools they need for a Swiggy analytics dashboard.
What is the Data Analyst Dashboard Project?
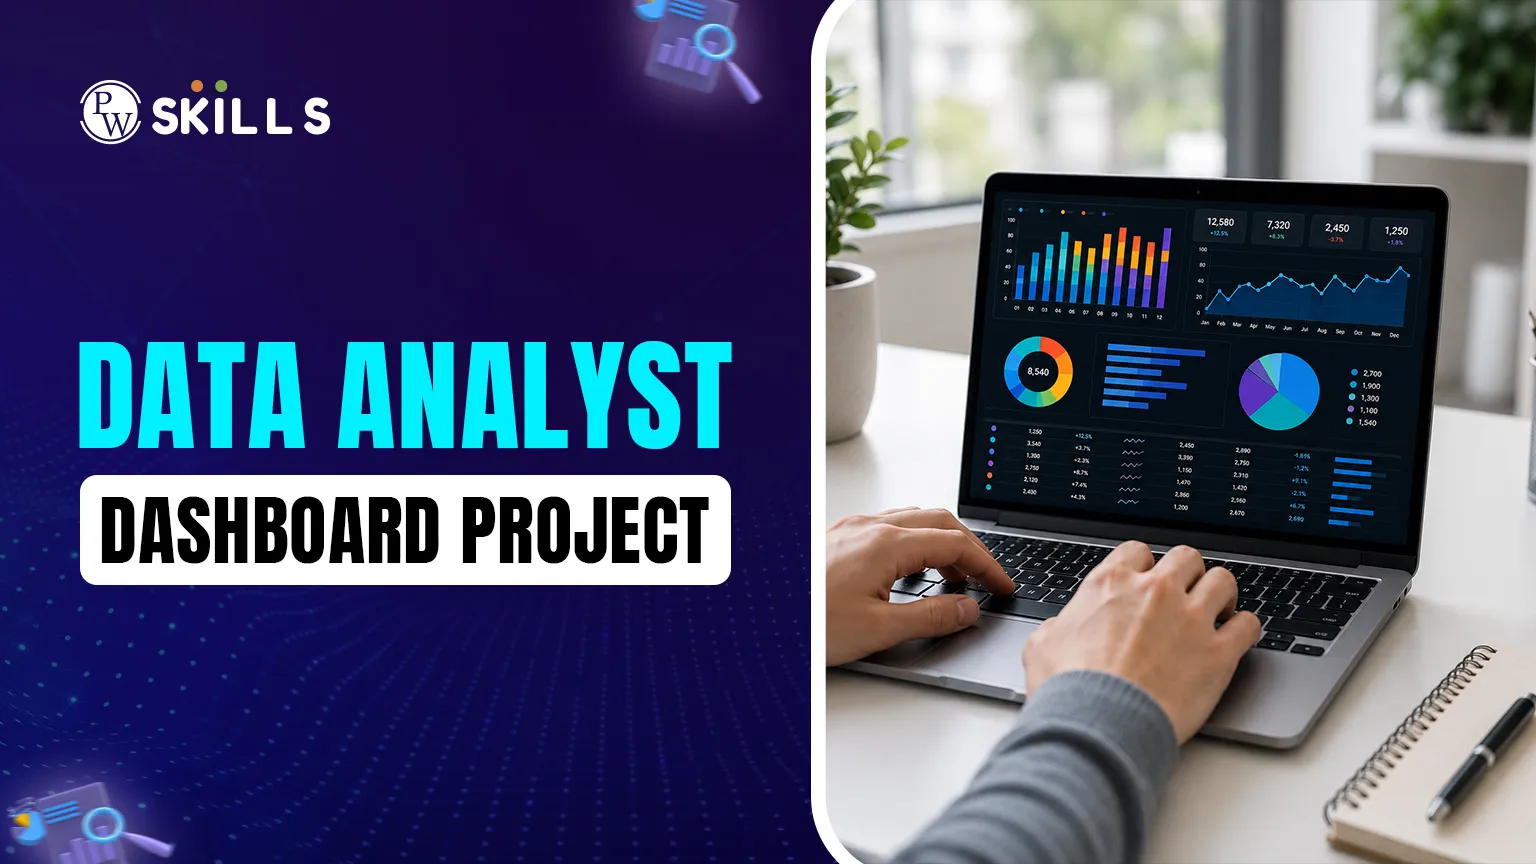
A data analyst dashboard project is more than a bunch of colourful charts. It is the one place that turns dry numbers into stories you can act upon. Description: This project involves tracking three key groups within a food delivery giant: customers, restaurant partners, and delivery executives, which are referred to as 'The Three Pillars'.
The main purpose of this type of project is to track KPIs in real-time. These include average order value (AOV), delivery time variance, and customer churn rate. A modern data analysis dashboard is not a static report. It gives stakeholders (like city managers or marketing heads) the ability to filter data through location, time of day, and cuisine category so that they can notice trends immediately.
Designing an analytics dashboard like Swiggy's requires a solid understanding of data architecture. Your scoresheet may not be a single table, but data from multiple sources that you would have joined with the results. For example, one might use GPS data from delivery riders, along with transaction logs from the app, to obtain a precise quantification of efficiency in any given delivery area.
Daily Work Schedule of a Data Analyst
The career of a professional real-world data analyst is hardly ever linear. It's part technical troubleshooting and part creative problem-solving. A day in the life looks like this:
Morning: Data Integrity and Health Checks
Usually, we start with a sanity check. The Data Analyst starts by ensuring that the automation data pipelines used to load and ingest information into the analytic system are designed, built, or configured to work before any analysis can be done.
-
Checking ETL Pipelines: Validation that yesterday's orders have been successfully migrated to the data warehouse.
-
Identifying Anomalies: Searching for instant spikes or plunges. If North London orders suddenly plummet to zero, it’s probably a data bug rather than everyone there losing their appetite all at once.
Afternoon: The Core Build and Refinement
This phase is where the bulk of your dashboard for analysis rests.
-
Data Cleaning: The data that is in our Swiggy analytics dashboard is mostly messy. Column "Customer Feedback" may have duplicates or null values. Analysts then spend hours scrubbing this data in SQL or Python to make sure it doesn't bias the results.
-
Logic Implementation: Writing calculated fields. e.g. When you make a new formula for "net revenue" after restaurants' commissions and delivery subsidies.
-
Visual Mapping: Picking the visual & comprehension chart Though a pie chart might look appealing, it would be much better to use a heat map that makes clear which areas of the city have the most density.
Evening: Stakeholder Feedback and Iteration
No data analysis dashboard is ever truly "finished"; you will always be learning about how customers interact with your product and, as a result, understanding what changes will tell a different story. And most of the evenings, we generally spend presenting results to team leaders.
-
User Acceptance Testing (UAT): Showing the dashboard to a manager, who has no technical background, and expecting him/her to easily find their way through it.
-
Documentation: Write out the logic using specific metrics so that other team members can use that workflow later.
Skills Required to Become a Data Analyst
For real-world data analyst work, you need a particular set of tools. It is not really about a single piece of software; it is about how these tools come together to create a cohesive project.
-
Advanced SQL Knowledge: The basic building block for such work to even happen. A Swiggy dashboard is a huge database, and as a developer, you will need to extract specific insights from it using joins, subqueries, window functions, etc.
-
Data Visualisation (Power BI or Tableau): You should know which chart tells the right story. When designing dashboards for data analyst projects, you can use an interactive map to show delivery hotspots.
-
Python for Data Cleaning: Real-world data is dirty. You use libraries such as Pandas to handle missing entries, remove duplicates, and format timestamps so they line up across time zones.
-
Statistical Proficiency: If you know how a "mean vs. median" delivery time works, you're not going to be tricked into believing the one time it took 3 hours for some poor sap because of a broken-down truck was common.
-
Problem-Solving Mindset: A data analyst's work in the real world is a constant exercise in troubleshooting. You require the ability to debug code, and you also need a curiosity about why some metric just doesn't seem to work right.
-
Effective Communication: Explain technical data results to a marketing team unfamiliar with SQL.
Benefits of Studying Data Analytics
So, why do companies spend millions of dollars on such projects? There are enormous benefits to both the business and the individual analyst from properly executing dashboards for data analysis.
1. Real-Time Decision Making
If it were not for a Swiggy dashboard, managers would have to wait until their weekly reports. Using it, they can observe a drop in orders at 1 PM and push a promotion notification to users around 1:15 PM to increase sales.
2. Identifying Cost Leakages
Analysis often reveals "hidden" costs. A sample dashboard might indicate that specific restaurant packaging is leading to a higher incidence of spills, which in turn increases refund rates. The business saves thousands over time by addressing this problem.
3. Enhancing Customer Experience
Analysts can monitor real-time progress of deliveries across varying weather conditions to assist the operations team in assigning more precise ETA windows and potentially reducing customer agony.
4. Career Growth for Analysts
Professionals may consider this a mark of achievement when they complete any dashboard project for data analysis. It shows that you can work with large, real-world datasets and deliver value – the foundation of a data analyst's career in practice.


FAQs
1. What is the most important tool for a data analyst's dashboard project?
2. Can I build an analytics dashboard of Swiggy using only Excel?
3. How long does a typical dashboard for data analysis take to complete?
4. Do I need to know coding for data analyst work in the real world?
5. Why is the analytics dashboard of Swiggy a popular portfolio project?


Get Free Counselling Today
and Clear up all your Doubts
