What is Cluster Analysis?
Cluster Analysis is a statistical method that is used to group a set of data points into clusters based on the similarities and differences in the pattern of data. The major idea of clustering is to group similar objects into the same groups and different objects into other groups. It has a lot of advantages and uses in multiple fields like marketing, machine learning, and data mining with the purpose of identifying patterns for grouping.
Hence, the primary objective of cluster analysis as discussed before is to find similarity which depicts the uniqueness of the group while the difference between data points is shown by separate clusters.
Unlike other statistical methods, this method is typically used when there is no prior assumptions about the data.
When should cluster analysis be used?
One should use this methodology when they have to categorize data and items into groups based on similarities. However, the main idea of the groups made is not clear but all the data items are interrelated with each other.
Below are some detailed scenarios where cluster analysis can be used:
Recommendation Systems: You must have seen on YouTube, that you get recommendations for similar videos on the basis of your previously watched videos. This is done by cluster analysis only, to find similar users or products, which can then be used to suggest items a user may like based on their cluster.
Social Network Analysis: Similar to YouTube recommendations you must have also noticed getting suggestions on social media about some particular communities and other groups of users who interact frequently on social media platforms.
Anomaly Detection: Cluster analysis is also used to detect unusual patterns by identifying clusters that deviate significantly from others. This is further used to detect anomalies and errors.
City Planning: Now if you want to identify similar neighborhoods or regions based on factors like demographics, crime rates, or economic activity you can use clustering to group nearby landmarks and places to understand the geography of that region.
How is cluster analysis used?
Now, that we have the basic idea of cluster analysis, we must understand the process to use it.
STEP 1: Define the Objective
The foremost step involves the definition of your objectives. One has to clearly declare what you wants from that specified cluster and what all things you want to achieve through clustering.
STEP 2: Selection of Data
After clarifying your objectives you need to choose what all dataset and variables you find relevant for your analysis. This includes numerical categorization or mixed data types depending on the clustering algorithm.
STEP 3: Preprocess the Data
Now, when you have finally decided onto your datasets and variables , you need to handle missing values, normalize your datasets and further remove irrelevant features that might skew results and increase data redundancy.
STEP 4: Choose an appropriate Clustering Algorithm
The next step towards achieving clustering is to choose an appropriate clustering algorithm on the basis of your needs and goals. Some common algorithms include
- K-Means
- Hierarchical Clustering
- DBSCAN (Density-Based Spatial Clustering of Applications with Noise)
STEP 5: Running the algorithm
Now, after deciding on an appropriate clustering algorithm you need to run these ML algorithms carefully. Actual figures and numbers will be implemented into the algorithm and distinct clusters can be encapsulated.
STEP 6: Evaluate the Results
After examination of the algorithm you need to assess the quality of the clusters using evaluation metrics like:
- Silhouette Score: Measures how similar an object
- Inertia: Measures the sum of squared distances
- Purity or Homogeneity: Checks how well clusters match
Cluster analysis algorithms
Now as we all know that these algorithms are methods which are used to group similar data points into clusters based on certain criteria. This process can be done in various ways and hence we can say that there are several types of clustering algorithms, which can be used as per your needs and objectives.
1. K-Means Clustering
This clustering algorithm is a type of partitioning algorithm where partitions of the dataset into a predefined number of clusters (K) are done. Here, each data item is given a nearest cluster center, that are updated iteratively to minimize the sum of squared distances between points and their cluster centroid. This is the most commonly used algorithm for clustering which is used in Market segmentation, document clustering, image compression, etc. However, besides all these advantages this algorithm is a bit sensitive when it comes to initial cluster centers and requires a predefined number of clusters.

2. Hierarchical Clustering
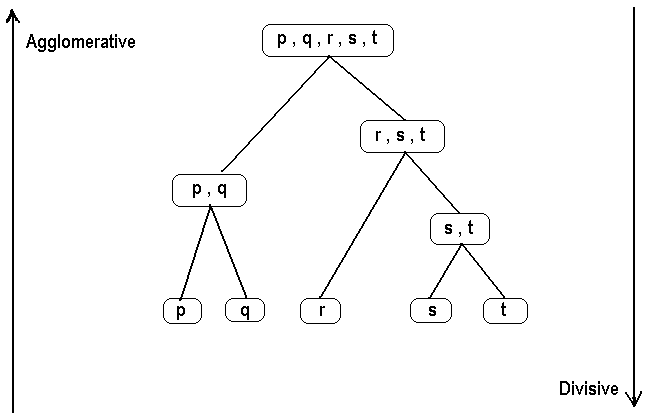
This is another type of agglomerative algorithm that creates a hierarchy of clusters by either merging smaller clusters (agglomerative) or splitting larger clusters (divisive). This process of merging and splitting is done until the desired number of clusters is reached. These are more advanced and can be visualized using a dendrogram to evaluate end results. Talking about its uses this algorithm comes in handy when it comes to social network analysis and other real-time evaluations. But this is a bit complex and Intensive for large datasets.

3. DBSCAN (Density-Based Spatial Clustering of Applications with Noise):
As clear from its name this algorithm is a density-based type of algorithm where It tends to group data points that are closely packed together based on a density criterion. Thus, this is used for fields like geospatial data clustering, anomaly detection, etc. You might find it a but difficult to implement and identify optimal parameters.

4. Mean Shift Clustering
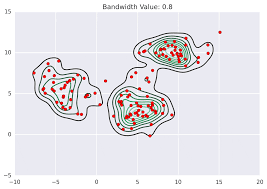
This type further is again a Density-Based algorithm model that aims to finds clusters by shifting data points towards areas of higher density. This further does not require specifying the number of clusters in advance. This algorithm is also extensively used in Image segmentation, tracking objects in computer vision etc. This algorithm is a bit expensive to implement for high-dimensional data.

5. Gaussian Mixture Model (GMM)
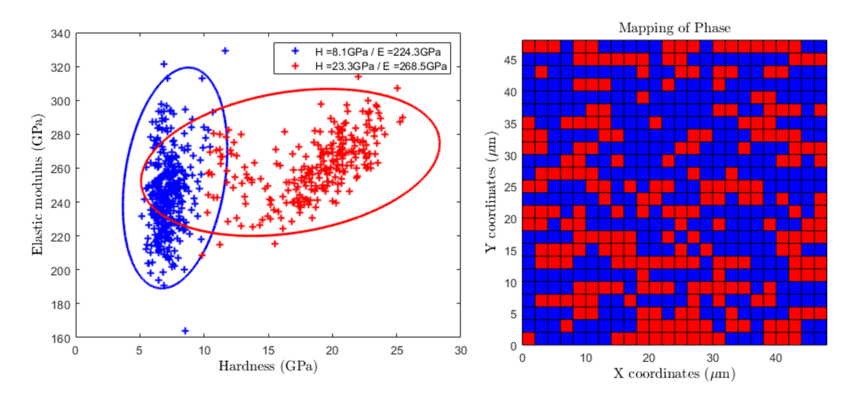
This algorithm type is more of a Model-Based algorithm that assumes the data is a mixture of multiple Gaussian distributions. Each cluster is represented by a Gaussian distribution, and the algorithm tries to maximize the likelihood of the data given in these distributions. However, this algorithm requires large datasets for more accuracy. Its uses include Speech recognition, finance, biology, etc.

Every algorithm applied and its results depend on factors like the shape of clusters, amount of noise, dataset size etc. Thus one should have adequate knowledge about the same.
Learn Data Analysis With PW Skills
Our PW Skills Data Analytics Course provides the latest resources and study materials to help you learn new technologies related to data analytics in a beginner-friendly way.
Below are some key benefits of this course that make it a standout choice for beginners:
- Blended Learning: Study through recorded and live lectures for a flexible learning experience.
- Career-Centered Curriculum: The course is designed to make you job-ready with a focus on career growth.
- Course Duration: This is a six-month course with over 200 hours of learning.
- PW Skills Lab Access: Get free access to our online lab to practice on cloud-supported compilers.
- Industry Projects: Work on 3+ real-world projects to gain hands-on experience in data analytics.
- Skills Covered: Learn Machine Learning, Python, Power BI, Excel, AWS, and more.
- Assessments: Practice through quizzes, assignments, and interactive doubt-clearing sessions.
- Regular Support: Get help from experts with live sessions, career guidance, and regular evaluations.
- Technology Mastery: Master tools like Matplotlib, Pandas, Scikit-Learn, MySQL, Excel, Power BI, AWS, NumPy, and Python.
- Certification: Earn a certification recognized by top companies to showcase your skills.
- Placement Assistance: We provide 100% placement support and connect you with leading tech companies to find your ideal job.
Cluster Analysis FAQs
What are the key steps in cluster analysis?
The key steps in cluster analysis are:
Defining the objective.
Selecting the data.
Preprocessing the data.
Choosing a clustering algorithm.
Determining the number of clusters.
Applying the algorithm.
Evaluating and interpreting the results.
Visualizing the clusters.
What is the K mean algorithm?
The K mean clustering algorithm is a type of partitioning algorithm where partitions of the dataset into a predefined number of clusters (K) are done. Here, each data item is given a nearest cluster center, which are updated iteratively to minimize the sum of squared distances between points and their cluster centroid. This is the most commonly used algorithm for clustering which is used in Market segmentation, document clustering, image compression, etc.
What are some popular tools for performing cluster analysis?
Popular tools for cluster analysis include:
Python Libraries like scikit-learn, SciPy, etc which are easy to use and understand.
Data Science Platforms including RapidMiner, SAS with all recent visualization Tools like Tableau, Power BI, etc

