Statistical analysis is a rapidly growing career with a wide range of benefits. It is an important tool when it comes to making smart informative decisions based on data. With the help of statistical analysis we can easily know people’s preferences, what might happen in the market, understand the behavior of people, and more.
In this blog, we will learn how to do statistical analysis in the same way. We will learn about different types, tools, and working of statistical analysis.
What is Statistical Analysis?
Statistical analysis is collecting, organising, interpreting, and presenting data to discover trending patterns, trends, relationships, and make informed decisions based on data.
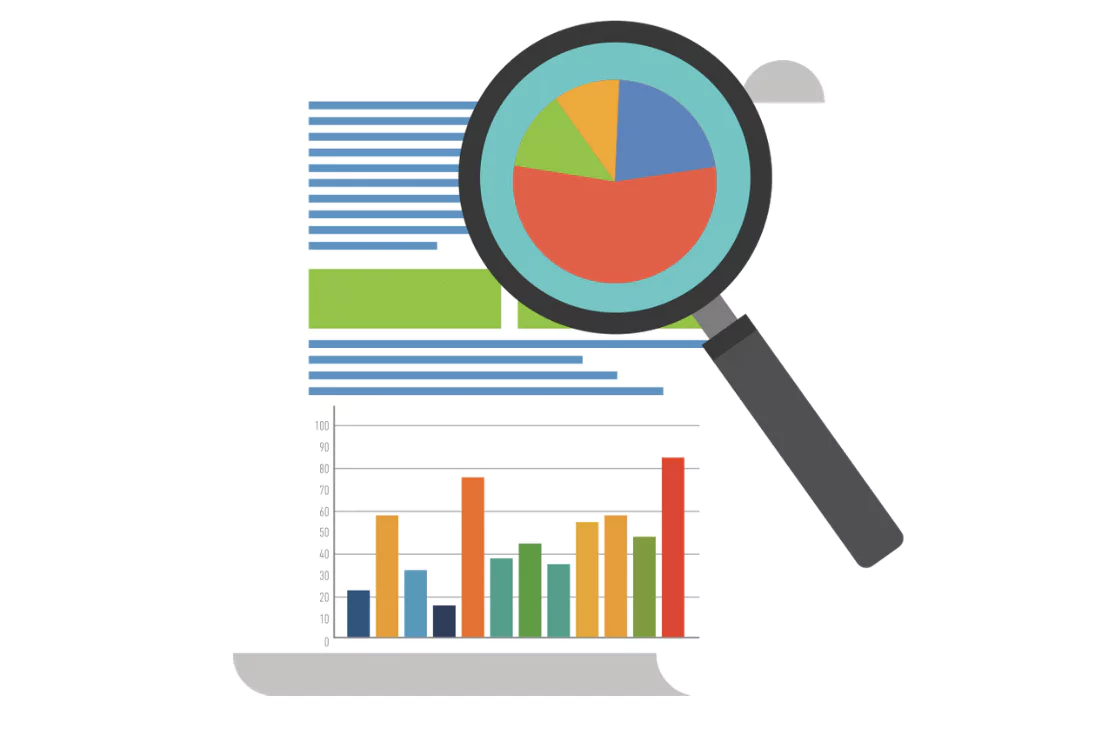
It involves mathematical tools and techniques to understand what the data is telling us. For example, you might use statistical analysis to find out the average age of customers, the correlation between hours studied and exam scores.
Read More: What is Exploratory Data Analysis? Complete Beginner Level Explanation
Why Is Statistical Analysis Important?
Statistical analytics is used to make informed decisions based on raw data. It helps in making informed decisions and predicting market trends. It is useful for market research, financial forecasting, risk management, and customer behavior analysis.
With statistical analytics we can easily uncover hidden trends, relationships and patterns existing in datasets which can be crucial for planning and forecasting. You can easily eliminate risks by analysing available data and making informed decisions which can promote growth of the business.
Is Data Analysis and Statistical AnalyticsS Same?

Data analysis and statistical analysis are not the same and share some major differences which must be taken into account.
Data Analysis
Data analysis is a complete overall term of inspecting, cleaning, transforming, and modeling data to extract useful insights from the data and help in making informed decisions. It uses various methods apart from statistics to operate on data for information.
Statistical Analysis
Statistical analysis is a part of data analysis which usually focuses on using mathematical techniques such as regression, hypothesis, mean, median, average, and more to understand data and extract useful insights from it. It is more based on statistics, probability and prediction.
Types of Statistical Analysis Techniques

There are two main types of statistical analysis methods which are frequently used in analysing data. Let us find more about them below.
1. Descriptive Statistical Analytics
Descriptive Statistical analysis is used to organise raw data and summarize them in a user-friendly manner which can easily be recognised and understood. It describes the basic features of a dataset by using methods like mean, median, mode, range, standard deviation, and other tools such as charts and graphs.
The main goal of descriptive statistical analytics is used to represent an overview or snapshot of the data. For example, when you are calculating the average test score of a class gives a general idea of overall performance.
2. Inferential Statistical Analysis
The inferential statistical analysis deals with describing important information about data used to make predictions about a larger population or data based on sample. The methods include correlation, regression, confidence intervals, hypothesis testing, and probability distribution, and more.
3. Predictive Modeling
Predictive modeling is a statistical method working based on machine learning and statistical algorithm techniques. It is used to predict the possible future outcomes based on available or historical data. It is widely popular among various fields such as healthcare, weather forecasting, marketing, finance, and more.
They train historical data to identify relations and patterns among variables which can be used to make predictions on unseen information and data. The common techniques of predictive modeling are linear regression, decision trees, neural networks and support vector machines.
4. Prescriptive Analysis
Prescriptive analysis is used to recommend favorable actions to businesses or organisations after receiving the predictions from the predictive models. It involves decision making to achieve objectives set by an organisation.
It analyses multiple future scenarios, weighs different options, and advises the best course of action based on various preferences set by the organisation. For example, a prescriptive model can suggest optimal discount rate for each product to maximize the profits while minimising the inventory costs.
5. Exploratory Data Analysis (EDA)
The Exploratory Data Analysis (EDA) is used to analyse datasets to summarize their main characteristics. It helps data scientists and analysts to get the knowledge of data and uncover insights, relationships, and issues that can affect analysis moving ahead.
![]() Join Our Data Analytics Telegram Channel
Join Our Data Analytics Telegram Channel
![]() Join Our Data Analytics WhatsApp Channel
Join Our Data Analytics WhatsApp Channel
Features of Statistical Analysis
Check some of the features of statistical analysis below.
1. Data Collection
Statistical analysis begins with the collection of raw data from various sources such as surveys, experiments, sensors, or databases. Accurate and relevant data collection ensures that the analysis reflects real-world conditions and forms the foundation for drawing reliable conclusions.
2. Data Organization
After we complete data collection then the data is organised in a complete structured format such as spreadsheets, charts, tables and more. This helps in popper analysis of the extracted data and easy interpretation.
3. Data Summarization
This involves using measures like mean, median, mode, variance, and more to give a complete overview of the data. It simplifies the complex data into usable insights allowing for important decision making.
4. Data Interpretation
This feature focuses on taking out conclusions from the data analysed which involves understanding the complete statistical results about the real world problems.
5. Hypothesis testing
After data interpretation the complete focus shifts on detecting patterns, correlations, behavior analysis and trends within the data. It uses hypothesis testing which allows for formal testing of assumptions about data using various techniques like Chi-square tests, ANOVA, T-tests, and more.
6. Forecasting & Predictions
The collected data is analysed and then used for forecasting about future trends or values such as sales forecasting, stock market analysis, weather predictions, and more.
7. Anomaly Detection
It is important to find outliers or anomalies in the data such as potential fraud, rare events, errors, and more. Statistical analysis can help in finding out the outliers in the data which is very important in finance, cybersecurity, and quality control.
Roles of Statistical Analysis

Statistical analysis makes use of mathematical formulas and techniques to make the raw available data understandable for the general public. With this you can use charts, graphs, and more methods to present key results for better decision making.
1. Data Summarization
Statistical analysis is used to simplify extensive & large volumes of data into meaningful summaries using methods like averages, percentages, and distributions. This helps users quickly grasp essential information present in the data.
2. Decision Making
It supports evidence-based decision-making by providing insights from data. Businesses, governments, and researchers use statistical evidence to choose the best course of action for a certain specific condition.
3. Identifying Patterns and Trends
Statistical tools in data analysis are used to uncover patterns, trends, and correlations in data, which are essential for forecasting, planning, and strategy development.
4. Hypothesis Testing
It allows for the validation or rejection of assumptions through formal tests, making research results more credible and reducing the risk of incorrect conclusions.
5. Process Optimization
Statistical analysis is used in quality control and operational efficiency, helping organizations reduce waste and improve consistency in industries and manufacturing.
6. Risk Assessment and Management
Statistical models help evaluate and predict risks and uncertainties, which is crucial in finance, healthcare, insurance, and project management.
7. Scientific and Academic Research
Statistical analysis is foundational in research for drawing reliable conclusions, publishing findings, and ensuring results are valid, reproducible, and significant.
Also Read:
- What Is Data Reporting And How Do You Create Effective Data Reports?
- What Is Data Interpretation? Comprehensive Guide
- What Are Micro Frontends? Definition, Uses, and Architecture Explained: A 9 Steps Effective Guide
- What Is a Cloud Data Platform And Why Should You Use One?
Learn Statistical Analytics with PW Skills
Cover every aspect of data analytics and statistical analytics with PW Skills Data Analytics Program. Learn all major techniques and frameworks used in major industries for data analysis. Get in-depth up to date lectures followed by live sessions and pre recorded tutorials.
Complete assignments, practice exercises, real world projects and strengthen your job portfolio to make yourself job ready. Get career guidance from our dedicated mentors and industry recognised certification after you complete the entire program only at pwskills.com
Statistical Analytics FAQs
Q1. What is Statistical Analysis?
Ans: Statistical analysis is used to make informed decisions based on raw data. It helps in making informed decisions and predicting market trends. It is useful for market research, financial forecasting, risk management, and customer behavior analysis.
Q2. Is Statistical Analysis different from Data analysis?
Ans: Statistical analysis is a part of data analysis which uses mathematical functions and equations such as regression, hypothesis, mean, median, average, and more to make sense of data and convert it into understandable form.
Q3. Why is statistical analysis used?
Ans: Statistical Analysis is used for converting data in a usable format making it more understandable and helping in making informed decisions for the future.
Q4. Why is it important to perform statistical analysis?
Ans: Statistical analysis is useful in converting raw data into understandable and organised patterns helping in making informed decisions for the companies. It helps in uncovering patterns, behavior analysis, and more.
Q5. Who can find a good career in statistical analysis?
Ans: Candidates who are interested in data analytics, statistics, probability and mathematics can make a good career in statistical analysis.

