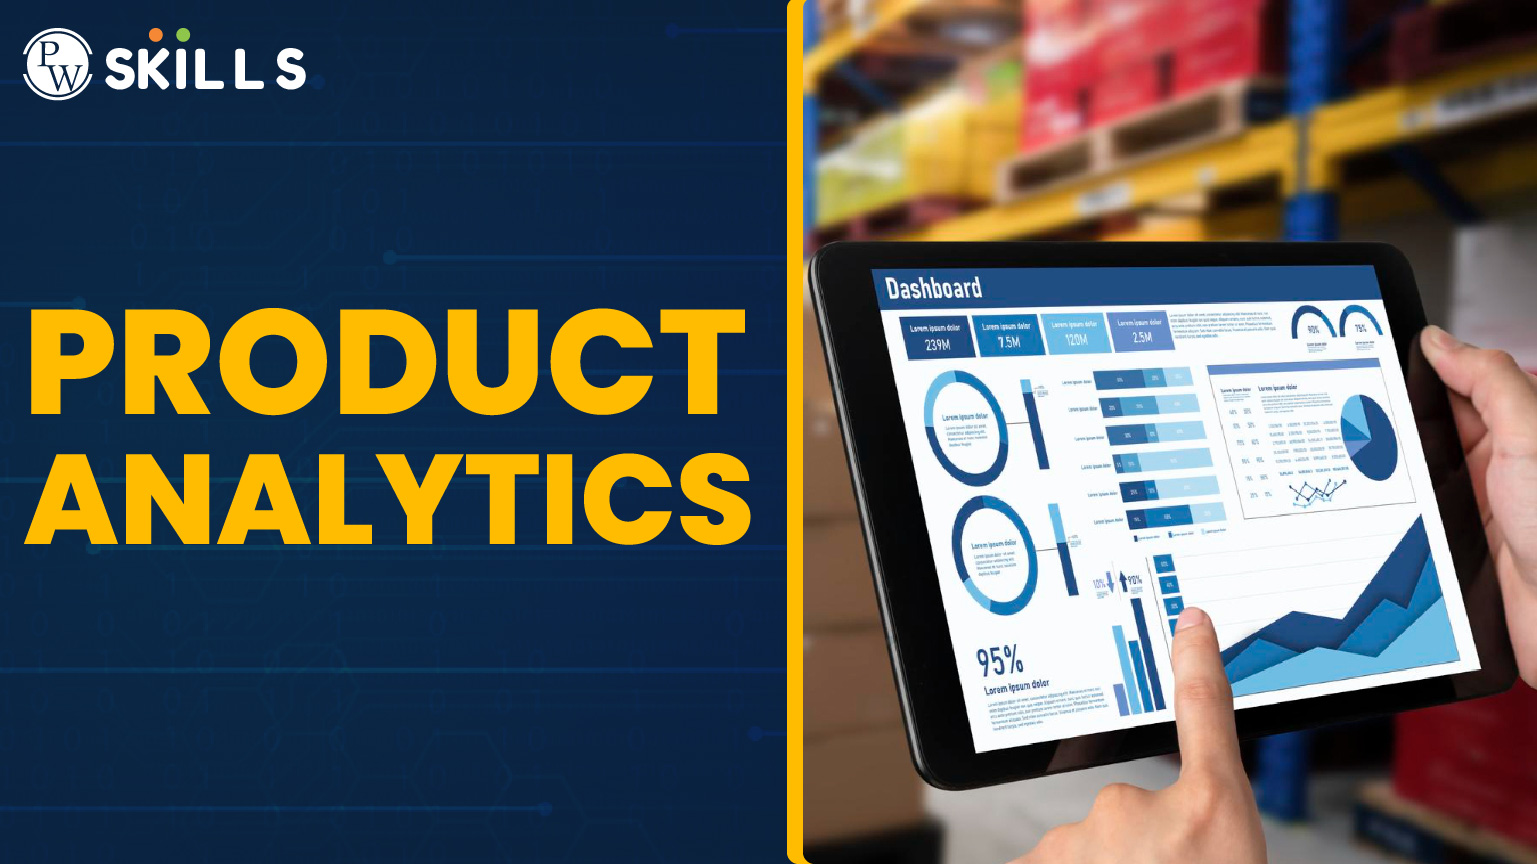
Product analytics 101 is one of the important tools used to gain real time insights and discover trends for products in the market. If you are planning to launch a product, set pricing, improve customer retention, roadmap, and more. It helps teams make smart, data driven decisions instead of just taking random guesses.
It deeply understands people’s preferences, the features they like, where they drop off, and what changes can lead to a better result such as more signups or purchases or better engagement with the product. In this blog, we will understand the role of product analytics in detail.
What Is Product Analytics?
Product Analytics is a process of collecting, analyzing, and interpreting data about how users can interact with the product using digital interfaces or devices like app, website, software. It clearly defines where users are facing problems, what they like the most, and how to improve the product for better performance and engagement.

Product analytics 101 can easily be used to track users behavior, feature usage, conversion rates, user retention, funnel analysis, and more. Businesses can make use of product analytics 101 to optimise their product design using insights and create more engaging and effective products which satisfies the needs of their users. You can use various tools to perform product analytics 101, such as Google Analytics, Mixpanel, Heap, Amplitude, and more.
Read More: What Is Product Failure? Definition and Prevention Tips
What is the Use of Product Analytics?
Product analytics is a very effective tool when it comes to making a product market fit, or taking better sales, engagement and retention. Product analytics 101 is concerned with collecting valuable insights in the form of trends, patterns, users behavior and more to gain a competitive advantage in the market.
- Collecting real time insights on how users interact with the product, teams can find the pain points and improve design, layout and overall user experience.
- It can help in identifying features which are ignored. This helps businesses to focus on features that matter the most and avoid those that no one wants.
- Product analytics 101 can be used to increase conversion and sales by fixing areas where people drop most in their complete journey.
- It helps understand how users return and how long they stay active. Pointing out where users leave can help businesses take steps to keep them coming back.
- Leverage data driven decision making using product analytics 101.
Read More: New Product : Concept, Importance and Challenges
Key Metrics Used In Product Analytics

Product analytics make products better, smarter and successful in all major terms. Some of the major key metrics of product analytics are mentioned below.
1. Customer Acquisition Cost (CAC)
Customer Acquisition or CAC is used to measure how much the cost involved in acquiring a new customer. It takes into consideration spending on marketing, sales, and promotions. It helps businesses understand whether their marketing efforts are cost effective, well planned and highlight their spending is justified.
2. Retention Rate
Retention rate is a metric that shows the percentage of overall customers who are actually returning to use the product over a specific period of time. A high retention rate of a product indicates that users find value in the product and are satisfied enough to keep coming back.
3. Churn Rate
Churn rate is an important metric to take in consideration as it reflects the opposite of retention which means it tells you the percentage of users who stop using your product or service. A high churn rate signals in a product analytics describe the potential issues with user experience, satisfaction, or relevance of the product.
Read More: What is Product Market Fit? | Definition and Examples
4. Average Revenue Per User (ARPU)
ARPU or Average Revenue Per User is used to calculate how much revenue, on average, a single user manages to bring in over a set period of time i,e. Weekly, monthly or yearly. It is very useful for measuring the earning potential of your user base and evaluating the financial health of the final product.
5. Lifetime Value (LTV)
Lifetime Value of a product is used to estimate the total revenue a business can expect from a customer over the entire time they stay active in the organisation. This enables organisations to make long-term plans and shows whether the cost of acquiring a customer (CAC) is justified by their value.
6. User Engagement Rate
User engagement rate is the measure of percentage of users who actually interacted with the product on a regular basis. A high engagement in a product depicts that the product is useful and is liked by users while low engagement may suggest the need for certain improvements in the product.
Read More: Product Vision: How To Define Yours In 4 Steps?
7. Average Session Length
Average session length determines how long on an average a user keep themselves engaged with the product during a single visit. Longer sessions in a product usually indicate higher interest and better user experience, while shorter sessions may highlight usability problems or disinterest concerns.
8. Conversion Rate
Conversion rate is an important factor in product analytics 101 which is used to track how many users complete a specific goal in product journey i,e. signing up, making a purchase, or upgrading a plan, and more. Also, it watches the number of total people who visited or interacted with the product. It’s a key metric for measuring product effectiveness and success.
9 Frequent Tools Used for Product Analytics

Tools are an important part in product analytics and make the complete analytics more effective and efficient. Let us know some of the tools used in product analytics 101 below.
1. Google Analytics

Google Analytics is the first choice of many when it comes to collecting real time effective insights. This tool can be accessed for free to track website and app traffic, user behavior, and conversion rates.
It is great at understanding where users come from, what pages they visit, and how long they stayed and interacted with the product. Google Analytics 4 (GA4) also supports event-based tracking and better insights across platforms.
2. Mixpanel

Mixpanel is an effective product analytics 101 tool used to understand user behavior and perform analytics. It can easily track specific users’ actions including clicks, signups, or purchases. It can build custom funnels and measure users retention rates. It is very much ideal for apps and SaaS products.
3. Amplitude

Amplitude provides features including converting deep insights into user behavior, product usage, and customer journeys. It is ideal for advanced cohort analysis, feature usage tracking, and understanding which actions lead to long-term retention and revenue.
4. Hotjar

Hotjar is a free product analytics tool which can present heatmaps, session recordings, and user feedback tools to help you visually understand how users interact with your website or product. It is an excellent tool for UX research and finding pain points in design or navigation.
5. Heap Analytics

Heap is used to automatically capture all user interactions i,e. clicks, form submissions, and page views without any need for manual tracking setup. It is effective, user-friendly and great for organisations that want quick insights without any significant technical effort.
6. Pendo

Pendo is a product analytics tool which can analyse and improve how users use software products across web, mobile SaaS and other agentic experiences. It helps product teams understand usage patterns, collect feedback, and guide users with tooltips or onboarding flows and all of these within the product itself.
7. Crazy Egg

Crazy Egg visualises users’ activities using heatmaps, scroll maps, and A/B testing tools to understand exactly where users are clicking or dropping off from a product. It’s especially very helpful for optimizing landing pages and improving conversion rates of the product.
8. Kissmetrics

Kissmetrics uses simple analytics to track human behavior to improve engagement and drive revenue growth. It tracks user behaviour over time to understand the complete journey of the customer. It is great for SaaS and ecommerce businesses who are looking to improve customer lifetime value and reduce churn rates.
9. Segment

Segment is a customer data platform tool used for integrating different applications as it helps connect user data from multiple tools like CRMs, Mixpanel, Amplitude, and more at one place. It helps ensure consistent data across your stack.
How to Setup Product Analytics 101 (Step by Step) Guide?
Check the simple step by step method of using product analytics 101 below.
1. Define Objectives
This stage is clearly concerned with defining and setting up the goals and KPIs to provide the right direction for businesses. The goals must include steps taken for the following.
- Increase user experience
- Increase market share
- Enhance product features
- Boost customer retention
Some KPIs for product analytics 101 include customer churn rates, user satisfaction scores, feature adoption rates, market penetration percentage and more.
2. Collect Data
This is an important stage in product analytics 101 where data from various sources is collected which is to be used for further analysis purposes. Data is collected from various sources such as heatmaps, reviews, testimonials, user testing, surveys, A/B testing, Market research and more.
3. Use Different Frameworks for Product analysis
There are various methods used in product analytics 101 to help identify users behaviour, patterns, and pin pointing the areas which need improvement.
Some of the popular methods used for product analytics 101 are statistical analysis, SWOT analysis, Thematic analytics, Predictive analytics, Value chain analytics, and more.
4. Track Competitors Analytics
You can track competitors’ analytics to track their product features, uniqueness and more to stand out or improve your product in multiple areas. You have to identify the gaps along with the best features that are really working for the competitors in the long run.
5. Data Optimisation
All the gathered data, competitor analytics, users feedback are now to be used for gathering important insights with effective metrics in product analytics 101. You can find the right tool to keep your tool accurate and active. You can easily make data driven decisions with tools like Google analytics, Mixpanel, Hotjar, and more.
Learn Product Management With PW Skills
Build a successful career in Product management under the guidance and supervision of dedicated mentors, latest industry based curriculums, capstone projects, and more. Build your AI knowledge and boost your productivity by 10 times at your workplace.
Enroll in our Product management Course and get a chance to build your job ready skills and exposure for this role. This program gets you through an easy roadmap for getting job ready skills and hands-on learning.
Want More?
- Get an advanced in depth learning completely based on smart agile methodologies, conduct strategic planning, market analysis and more.
- Prepare for your interview with guidance from dedicated mentors
- Get dedicated resume building sessions with mentors.
- Get industry recognised certifications and discover a wide range of opportunities in Product management only at pwskills.com
- Build a job ready profile with PRD from the scratch and work on a capstone project to strengthen your portfolio.
Product Analytics 101 FAQs
Q1. What is Product Analytics?
Ans: Product Analytics 101 is a process of collecting, analyzing, and interpreting data about how users can interact with the product using digital interfaces or devices like app, website, software.
Q2. What are the most important metrics in product analytics?
Ans: Customer Acquisition rate, retention rates, churn rates, average revenue per user, conversion rate, lifetime value are some of the major metrics used in product analytics.
Q3. Which is the best Product Analytics tool used in the market?
Ans: Google Analytics is the first choice when it comes to collecting real time analytics. This tool can be accessed for free to track website and app traffic, user behavior, and conversion rates.
Q4. Who uses product analysis?
Ans: Product managers make use of product analytics to understand how users are dining while interacting with the product. They learn how to optimise different product aspects to match users expectations and needs.

