

Measures of Spread – Range, Variance, and Standard Deviation
Learn how to keep a record of measures of spread using Range, Variance and standard deviation in this blog. These measures of spread are important factors which help to understand data efficiently.
Are you familiar with how we take measures of spread data around us from the dataset? It is important to be aware of how the data is being distributed in the dataset. We sometimes focus a lot on collecting and representing data that we forget to take into account other important factors in the data analysis.
In this blog, we will learn some of the best measures of spread and its importance in the data analysis process.
What are Measures of Spread?
Measures of Spread are used to represent how similar or different the set of observed values in a dataset is for a particular value or item. It includes calculating range, quartiles, variance and standard deviation. Measures of spread are important factors in data analysis as it helps to understand the complete data especially when it is complex and large to interpret. The spread of data can be measured only when the data is present in a numerical format and it can be arranged in an ordered way i,e. Increasing order or decreasing order from a low end value to high end value or vice versa. For example, let us consider two dataset i,e. A and B. We will take measures of data from these two datasets and analyse. Dataset A: 1,2,2,2,3,4,5,5,6,7, Dataset B: 2,3,5,5,5,7,10,12 Now, after taking a good measure of spread in the following two dataset we notice the mode in the dataset A is 2 and in dataset B is 5. We can measure the mean, central tendency, variance with the help of mean and standard deviation easily.Read more: 7 Best Data Analysis Courses For Beginners In 2025
What is the Definition of Range?
The Range of a dataset can be defined as the difference between the largest and smallest values in the data. Range = maximum value - minimum value Let us understand Range with a simple example, consider a dataset having values 5, 8, 12, 15, 20, 25. Now, we will measure the value of Range in the following dataset. Range = 25 - 5 = 20 Hence, the range of the following dataset is 20 which represents how the data is distributed within that range.What is the Definition of Variance?
Variance is a statistical measure that represents the average of the squared differences from the mean. It gives you an idea of how spread out or dispersed the values in a dataset are. For a population, the variance can be calculated with the following formula given below.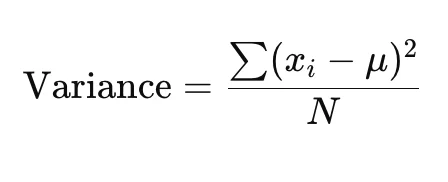 Where,
- x (i) represent each individual point in data
- μ is the mean of the dataset
- N is the total number of data points in the dataset.
- μ(mean) = 5+7+9/3 = 21/3 = 7
- Variance = (5 - 7)2 + (7 - 7)2 +(9 - 7)2 / 3 = 4+0+4/3 = 8/3 = 2.67
Read more: What is the difference between Big data analytics and Data analytics?
What is the Definition of Standard Deviation?
The standard deviation is the square root of the variance. It gives a measure of the spread or dispersion of a set of data points, but unlike variance, it is expressed in the same unit as the data itself, making it easier to interpret. A smaller standard deviation indicates that the data points tend to be closer to the mean, while a larger standard deviation suggests that the data points are more spread out. Let us get familiar with the formula of standard variation of a given dataset having mean, individual data point, and total number of data points.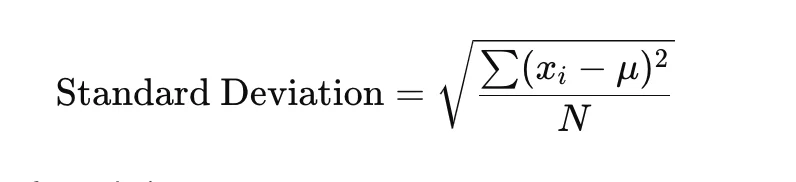 Where,
- x (i) represent each individual point in data
- μ is the mean of the dataset
- N is the total number of data points in the dataset.
Read more: What is Financial Data Analysis for Complete Beginners?
Difference Between Range and Variance
Let us analyse some major differences between the Range and variance in measures of spread.| Range | Variance |
| Range is the difference between the maximum and minimum values in a dataset. | Variance is the average of the squared differences from the mean of the dataset. |
| Range is calculated using the difference between highest and lowest value in a dataset. | Variance is a deeper analysis calculated for each value using mean. |
| Range = Max−MinRange=Max−Min | |
| A simple single value representing the spread of the dataset. | A measure of dispersion showing how data points vary around the mean. |
| The same units as the data points. | The squared units of the data points (e.g., if data is in meters, variance is in square meters). |
| It is very sensitive to extreme values (outliers) as it only looks at the max and min values. | It is less sensitive to outliers because it considers the overall distribution of data and uses squared differences. |
| It gives a quick estimate of how spread out the values are between the highest and lowest points. | It provides a more detailed measure of how each value deviates from the mean and is typically used for deeper statistical analysis. |
| It is simple to calculate, requiring only the highest and lowest values. | It is more complex, requiring the calculation of the mean and squared differences for all data points. |
| It is ueful for quickly understanding the spread of dataset. | It is used for more detailed statistical analysis, often when measuring dispersion and variability. |
Difference Between Variance and Standard Deviation
Let us analyse some major differences between the variance and standard deviation in measures of spread.| Variance | Standard Deviation |
| Variance is used to measure the average squared deviation using the mean. | Standard deviation is used to measure the average distance of a value from the mean. |
|
|
| Its units are squared (e.g., square meters, square seconds). | It is measured using the same units as the data. |
| It indicates the degree or measures of spread in squared units | It represents the measures of spread in the same unit as the data. |
| It is used in statistical models and analysis. | It is used in measuring data spread in dataset and also in describing various entities in data. |
| It involves squaring and averaging of data items. | It involves taking the square root of variance, making it slightly more complex. |
Sample Questions & Answers for Measures of Data
Let us solve some of the relatable questions of measures of data get more familiar with this topic. 1. What is the mean of the following dataset? Dataset: 5, 8, 12, 14, 16, 18, 22 Answer: The mean is the sum of all values divided by the number of values. Mean=5+8+12+14+16+18+22/7=957≈13.57 So, the mean is approximately 13.57. 2. What is the median of the following dataset? Dataset: 9, 1, 7, 3, 5, 4, 8 To find the median, first, sort the data in ascending order: 1, 3, 4, 5, 7, 8, 9. The median is the middle value. Since there are 7 values, the median is the 4th number i,e. 3. What is the mode of the following dataset? Dataset: 3, 7, 3, 8, 9, 10, 3 The mode is the number that appears most frequently in a dataset. Here, the number 3 appears 3 times, while other numbers appear only once. Mode = 3. 4. What is the range of the following dataset? Dataset: 25, 40, 15, 30, 10, 50 Answer: The range is the difference between the highest and lowest values in the dataset. Range=50−10=40 So, the range is 40. 5. What is the variance of the following dataset? Dataset: 4, 7, 10, 13 To calculate variance:- Find the mean: Mean=4+7+10+13/4 = 344=8.5
- Subtract the mean from each data point and square the result: (4−8.5)2=(−4.5)2=20.25 (7−8.5)2=(−1.5)2=2.25
- Find the average of these squared differences: Variance=20.25+2.25+2.25+20.25/4=45/4=11.25
Read more: Data Analysis AI tools, Work And Benefits
6.What is the standard deviation of the dataset from the previous question? The standard deviation is the square root of the variance. From the previous calculation, the variance is 11.25. Standard Deviation=11.25≈3.35Standard Deviation=11.25≈3.35 So, the standard deviation is approximately 3.35. 7. Calculate the mean, median, and mode for the dataset below: Dataset: 12, 15, 15, 18, 20, 20, 20, 24, 30- Mean: Mean=12+15+15+18+20+20+20+24+30/9=174/9 ≈19.33
- Median: Since there are 9 values, the median is the 5th number when arranged in ascending order: 12, 15, 15, 18, 20, 20, 20, 24, 30. Median = 20.
- Mode: The number 20 appears 3 times, more than any other number. Mode = 20.
Learn Data Analytics with PW Skills
Become proficient in data analysis and business analysis with PW Skills Data Analysis Course. Get technical expertise and soft skills with in-depth tutorials, exercises, real world projects and module level assignments. Get dedicated tutorials from dedicated mentors from industry led live sessions and recorded tutorials. Get certification from PW Skills after completing the course.


Measures of Spread FAQs
Q1. How can we take the measures of spread in a data?
Ans: We can keep a record of the measures of data using range, variance and standard deviation.
Q2. What is the range of data?
Ans: The Range of a dataset can be defined as the difference between the largest and smallest values in the data.
Q3. What is variance in data?
Ans: Variance is a statistical measure that represents the average of the squared differences from the mean. It gives you an idea of how spread out or dispersed the values in a dataset are.
Q4. What is the difference between variance and standard deviation?
Ans: Variance is used to measure the average squared deviation using the mean while Standard deviation is used to measure the average distance of a value from the mean.