Regression is an important part of machine learning which falls under supervised learning. Reading this article will help you to clear all your doubts regarding linear regression in machine learning.
Regression in Machine Learning
Regression in machine learning helps us understand how different factors relate to each other and how they influence an outcome. By using algorithms, we can spot patterns in data and use these patterns to make predictions for new situations. For example, we might use regression to predict how much a house will cost based on its size and location. It’s like learning from past experiences to make smarter guesses about the future.
Types of Regression Models
Regression models are basically of three types which include:
- Linear regression
- Polynomial regression
- Logistics Regression
Linear Regression
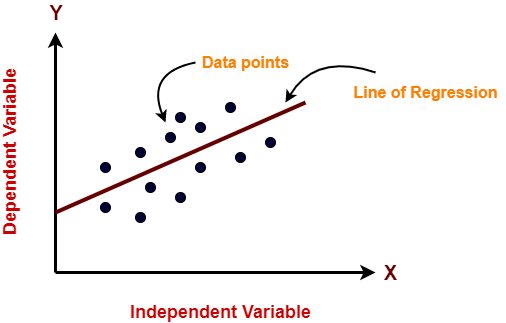
Linear regression in machine learning is a method used to understand and predict the relationship between two variables, these two variables are basically referred to as the input variable (independent variable) and the output variable (dependent variable). The goal of linear regression is to find a linear equation that best fits the data points, allowing us to make predictions about the output variable based on the input variable.
Let us understand linear regression with a simple example to make it more clear:
Imagine plotting points on a graph where one axis represents the input variable (like temperature) and the other axis represents the output variable (like ice cream sales). Linear regression helps us draw a line through these points that shows the general trend or pattern in the data. This line can then be used to estimate the ice cream sales (output value) based on the temperature (input values).
Hence, we can say that linear regression is a fundamental technique in machine learning for understanding and predicting linear relationships between variables.

Consider this diagram and relate this with an example shared above, where temperature is an independent variable and icecream is a dependent variable which is dependent on temperature.
If the temperature rises, sales of ice cream will also increase and vice versa.
Positive Linear Relationship
In this type of linear relationship if the dependent variable on the Y axis rises, the independent variable on the X axis will also rise.
Example of this type of variable is shown in the picture above.
Negative Linear Relationship
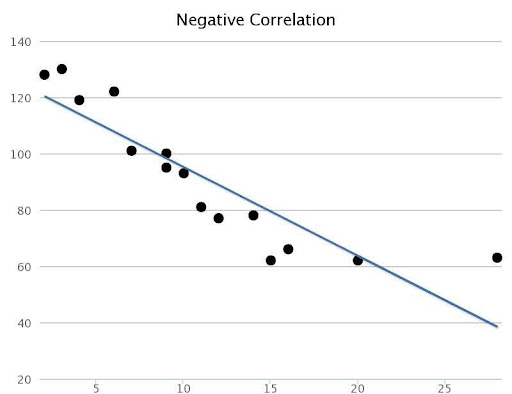
In this type of relationship, the dependent variable on the Y-axis decreases and the independent variable at the X-axis will increase.
Example of the same is given below for your reference.

Gradient Descent
Gradient descent is a method used in linear regression to find the best parameters for the linear equation that fits the data. It is basically a optimization technique that iteratively adjusts the parameters of the linear equation to minimize the difference between predicted and actual values, helping us find the best-fitting line for our data
In simple terms, it’s like adjusting the slope and intercept of the line until it aligns closely with the actual data points.
Applications of Linear Regression
Linear regression is a widely used technique in machine learning enabling us to make predictions analyzing past trends.
some basic applications of linear regression are:
- Financial Forecasting – Analysts use linear regression to forecast stock prices, market trends, sales projections, and much more.
- Risk Assessment – Insurance companies use linear regression to assess risk factors and predict insurance claims, premiums, and policyholder behavior.
- Customer Relationship Management (CRM) – Businesses use linear regression to analyze customer data, predict customer lifetime value, and personalize marketing strategies.
How to Implement Linear Regression
- To implement linear regression model, you first need to implement some basic libraries in your PC which include:
- import matplotlib.pyplot as plt
- import pandas as pd
- import numpy as np
- In the next step, You have to define the Data set in the program code, like:
x= np.array([2.4,5.0,1.5,3.8,8.7,3.6,1.2,8.1,2.5,5,1.6,1.6,2.4,3.9,5.4])
y = np.array([2.1,4.7,1.7,3.6,8.7,3.2,1.0,8.0,2.4,6,1.1,1.3,2.4,3.9,4.8])
n = np.size(x)
- In the third step, we need to define our X-axis and Y-axis and have to plot the defined Data sets accordingly.
Learn Machine Learning with PW Skills:
Enrol in our AI Course to learn the principles, basics and knowledge of all the tools required for Machine Learning. Whether you are a beginner or an individual looking to switch your career, this Machine Learning Course course will be a right fit for you:
Providing a roadmap, and knowledge of all the tools with updated syllabus curriculum , interactive classes, practice material, regular doubt sessions and guidance from experienced teachers for your better understanding helps you to get your desired job in the field of Machine Learning.
FAQs on Linear Regression
What is linear regression in machine learning?
Linear regression is a supervised learning algorithm used to model the relationship between a dependent variable and one or more independent variables by making a linear equation.
How does linear regression differ from logistic regression?
Linear regression basically predicts continuous numerical values, while logistic regression predicts binary outcomes in the term of yes/no or 0/1.
How is the accuracy of a linear regression model evaluated?
The accuracy of a linear regression model is evaluated using metrics like Mean Squared Error (MSE), Root Mean Squared Error (RMSE), and Mean Absolute Error (MAE).
What is the impact of outliers on linear regression?
Outliers can pull the line towards them, making the slope and intercept of the line change. This can cause the model to make predictions that are not accurate. In order to make model predictions more accurate and reliable it is important to deal with outliers properly.

