Confidence intervals are used by organisations to get confidence in their predicted or estimated value. This helps them get certain about a new course of action, investment, or strategy after getting through a sample of data collected from various relevant sources.
Confidence intervals help us ensure that the given data generated from a prediction, experiment, or testing relates to the specific cause or not. Here, let us learn more about confidence intervals, their importance, and how we can calculate them for our sample data.
What Are Confidence Intervals?
A Confidence Interval in statistics is a range of values that is likely to satisfy a given sample of data or contain a true value within a degree of confidence. It is used to estimate an unknown statistical parameter, such as the population mean. The general formula for a confidence interval is given below.
| Confidence Interval = Sample Statistic ± Margin of Error |
For example, consider yourself a detective having a sample of a suspect. Now, when the question arises about the height of the suspect, instead of telling the average height, you might not be sure about it. You might say, “I am really confident that the suspect’s height is probably in the range of 173 cm and 177 cm.” This marks the “Confidence interval”
Read More: Top Data Science Interview Questions 2025 For Beginners And Professionals
Confidence Interval: Key Takeaways
- A confidence interval is a range of values for which we are reasonably confident the true population mean lies.
- A confidence interval provides value in a range of values along with the confidence level.
- It does not provide a single point estimate of an unknown statistical parameter.
- A confidence interval includes the sample mean along with the margin of error.
- Most often, the analyst defines the confidence level between 95% 99% when calculating the confidence intervals.
Why Use a Confidence Interval?
A confidence interval is used by the analysts to understand whether their available sample estimation or prediction matches the actual population. A confidence interval is a means of letting you measure how well your sample represents the population you are studying.
- They are used to quantify a certain level of precision or uncertainty in data analytics. When you say the confidence level is 95% then it means 95 out of 100 intervals will contain the true mean.
- It provides a clearer way to perform hypothesis testing.
- A confidence interval delivers the degree of certainty or uncertainty in a sampling method.
Confidence Interval Formulas
Check the standard formula used to measure the confidence interval given below.
| Confidence Interval = Sample Statistic ± Margin of Error |
The margin of error here is the radius of the confidence interval. Here, the margin of error is given below.
| Margin of Error = Critical Value × Standard Error |
Let us check a simple example to understand how we are using confidence intervals in the available data. Do you know margin of error is dependent on various factors? Check them below.
| Factor | Change in Factor | Effect on Margin of Error |
| Sample Size (n) | ↑Larger | ↓Smaller |
| Confidence Level (1−α) | ↑Higher | ↑Larger |
| Population Variability | ↑Greater | ↑Larger |
A poll reports that 52% of voters support candidate A with a ±3% margin of error at a 95% confidence level. The given survey conveys that the true percentage of the entire population who support candidate A is likely to be somewhere between 49% (52% – 3%) and 55% ( 52% + 3%).

If you repeat the sampling process a number of times, the true population percentage would fall within a range of 95% of the intervals you calculate.
What Is A 95% Confidence Interval?
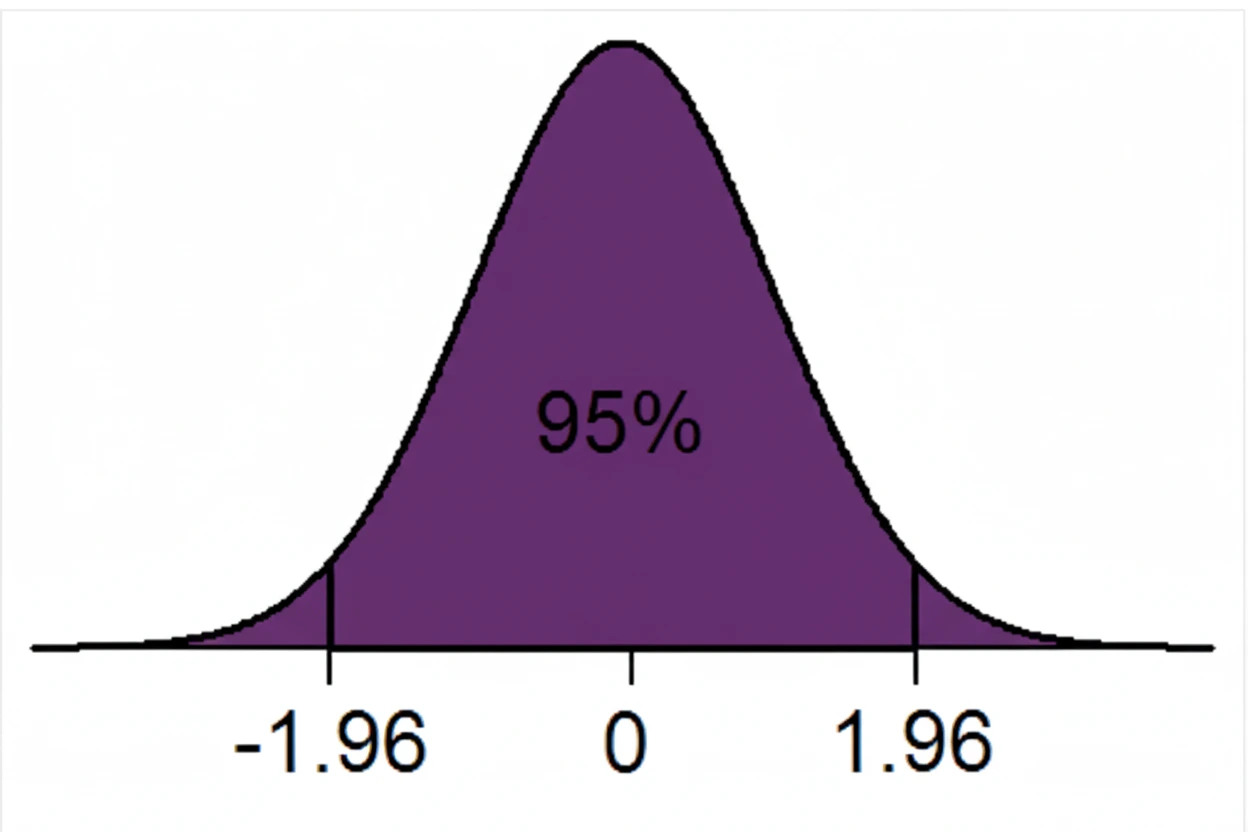
In the Confidence Interval graph, the 95% confidence interval is the range of values where 95 out of 100 intervals will contain the true mean value. This is obtained when we repeat the sampling method a particular number of times, resulting in the 95% confidence metrics.

Here, the probability of the population mean value is in the range of -1.96 and +1.96 standard deviations from the sample mean is 95%. There is a 5% chance that the population mean lies outside of the upper and lower confidence intervals.
When you increase the sample size, the range of the interval will narrow, which means for more accuracy, you will need more sampling.
Read More: A Complete Guide To Math And Statistics For Data Science
How to Measure the Confidence Interval?
Let us check the confidence interval by following these simple steps.
1. Identify the Sample Problem
You have to define the population parameter you need to find the estimation. For example, if you want to calculate the mean height of students, you will have to calculate the sample mean.
2. Select a Confidence Level
You can select a confidence level i,e. 90%, 95%, 99% or more. It represents how sure we are about the sample or prediction we are trying to estimate.
3. Calculate the Margin of Error
You have to calculate the margin of error using the critical value and standard error.
| Margin of Error = Critical Value × Standard Error |
- Critical Value: It is calculated using the Z-tables and t-table. The z-table is used when the sample size is larger, and the t-table is used when the sample size is smaller.
- Standard Error (SE): This is used to measure how much the sample mean varies in a given sample of data.
Here, the formula for standard error is calculated using.
| SE = Standard Deviation/ sqrt(n) |
4. Calculate Confidence Interval
You have the values now, use them to calculate the confidence interval. Use the point estimate and add or subtract the margin of error to get the confidence interval range.
Calculate Confidence Intervals In a Sample of Data
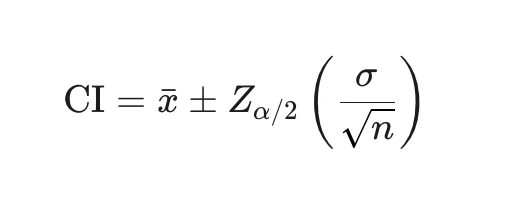
You can use the formula given below to find the confidence interval. You will have to keep the population mean (μ) using a large sample size (n) or population standard deviation (σ).
 |
Here,
- xˉ is the sample mean
- Zα/2 is the critical Z-value
- σ/ sqrt(n) is the Standard Error of the mean value.
- The complete term after the plus and minus signifies the margin of error.
1. Get Mean and Standard Deviation
From the desired sample of data, you have to list out the mean value and standard deviation. These data are to be used in the calculation of the confidence interval.
2. Use the z-distribution or the t-distribution
You can either use the z-distribution or the t-distribution to calculate the confidence interval of the data given.
- The t-distribution is used when the sample size is small and the population standard deviation is unknown
- The z-distribution is used when the sample size is large and the population standard deviation is known.
3. Use Python to Calculate Confidence Interval
You can calculate the Confidence interval using Python programming below.
Take a sample of 40 adult males having an average weight of 72.5 kg with a standard deviation of 8.4 kg. We have to calculate the 95% confidence interval for the true mean weight of the adult males.
| from scipy import stats
import numpy as np # Given data mean = 72.5 std_dev = 8.4 n = 40 z = 1.960 # Standard error se = std_dev / np.sqrt(n) # Margin of error moe = z * se # Confidence interval lower = mean – moe upper = mean + moe print(f”Confidence Interval: ({lower:.2f}, {upper:.2f})”) |
Output
| Confidence Interval: (69.89, 75.11) |
Confidence Intervals FAQs
Q1. What is a Confidence interval?
Ans: A confidence interval is the range of values for which we are reasonably confident the true population mean lies. It includes the sample mean along with the margin of error.
Q2. What does a 95% confidence interval mean?
Ans: A 95% confidence interval is a range of values that contains 95 out of 100 intervals that will contain the true mean. If you repeat the sampling process many times, 95% of the time you will get a real value in the range.
Q3. What is a good confidence interval value?
Ans: A good confidence interval value is 95% which is more realistic and suitable for a range of values. You might also see 99% CI, but they are not more likely.
Q4. How do you interpret a confidence interval value?
Ans: A good confidence interval value provides a range of values for an unknown parameter. You can calculate the confidence interval using the sample, confidence level, and margin of error.

