The world of machine learning, as described by the theory of knowledge, is analogous to building an intricate puzzle. As a student or a chartered professional, with real-world data, there’s much to ponder and appreciate about hierarchical clustering that enables you to grasp convoluted interactions exhibited not mechanically but visibly and intuitively.
What is hierarchical clustering?
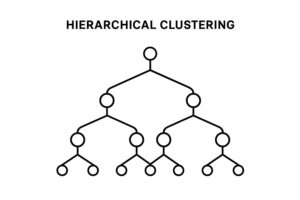
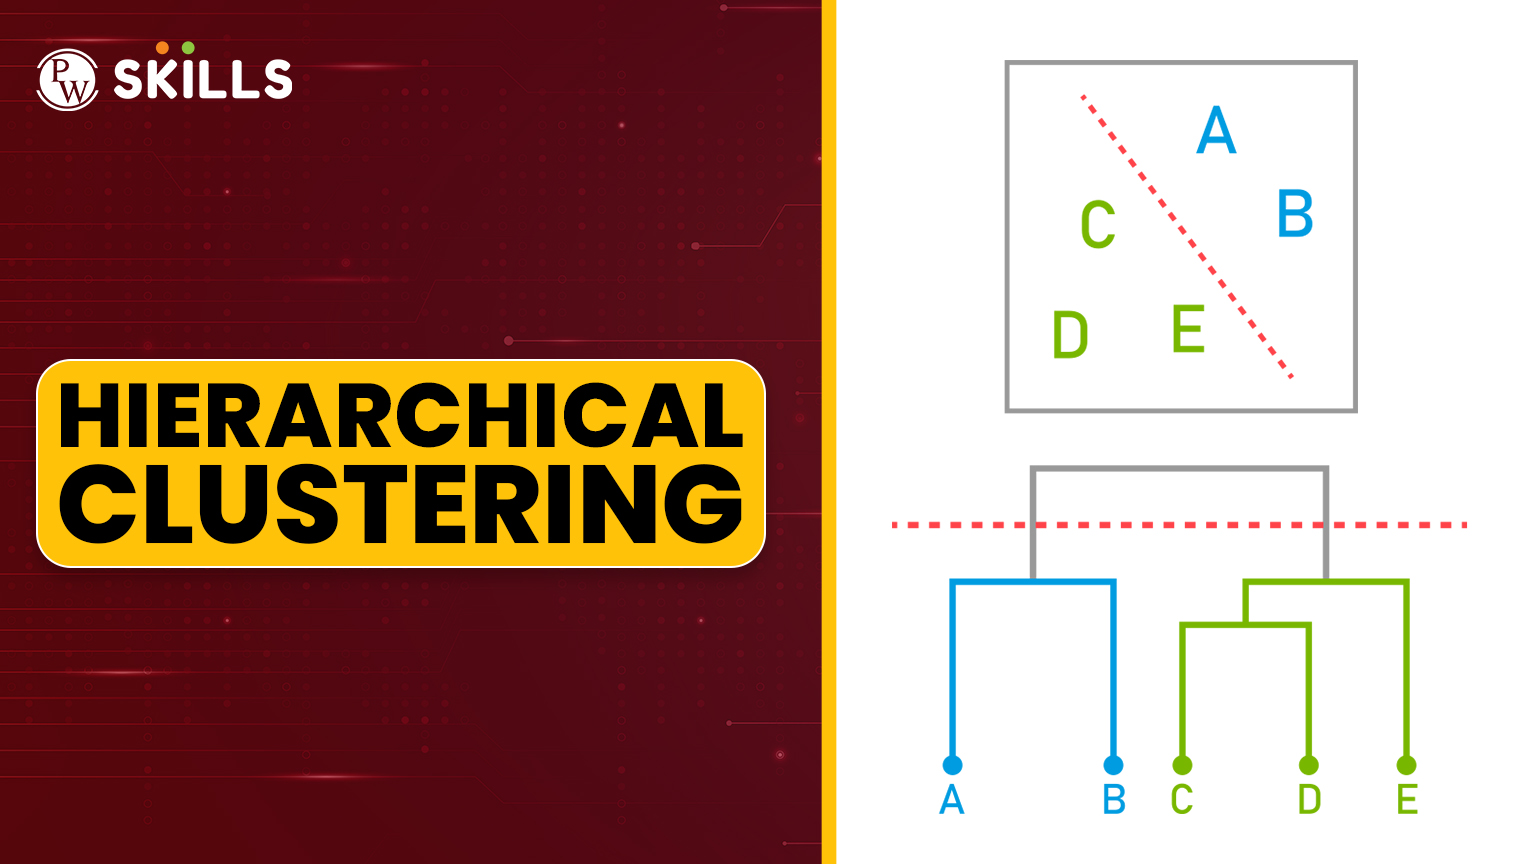
Hierarchical clustering is an unsupervised machine learning technique that divides related data points into clusters arranged in a tree-like structure called a dendrogram. Unlike methods like K-Means, hierarchical clustering does not require specifying the number of clusters beforehand.
It is widely used in market segmentation, document classification, image grouping, and biological taxonomy. In simple terms, hierarchical clustering shows you how data points are related, from the most similar pairs up to the largest combined group.

Why Learn Hierarchical Clustering in Machine Learning?
There are three significant advantages to learning about it in machine learning:
- Exploratory Power – Ideal when you have no prior idea about the number of clusters.
- Visual Insights – The dendrogram makes it easy to understand data relationships.
- Wide Applications – From retail to genetics, it’s everywhere.
Whether you’re a student or professional breaking new ground in analysis, hierarchical clustering delves deeper into the multitude of handy tools in machine learning.
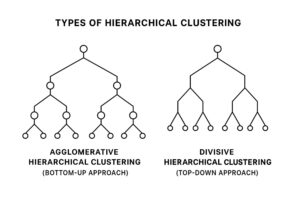
Types of Hierarchical Clustering
-
Agglomerative Hierarchical Clustering (Bottom-Up Approach)
Start: Each point is its own cluster.
Merge: Combine the closest clusters step by step.
End: All points form one big cluster.
(Most commonly used method in practice.)
-
Divisive Hierarchical Clustering (Top-Down Approach)
Start: All points are in one large cluster.
Split: Separate into smaller clusters step by step.
End: Each point stands alone.
(Less common but useful for broad-level clustering first.)

How Hierarchical Clustering Works Step-by-Step
- Calculate all possible distances between data points (Euclidean, Manhattan, or cosine distance).
- Construct a similarity-based matrix.
- Merge the available clusters together or subsequently add points.
- Observe: Draw the dendrogram for visualization.
- Lastly, choose a height to determine the clusters.
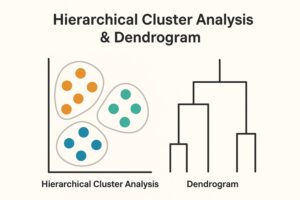
Hierarchical Cluster Analysis & Dendrogram
A dendrogram stands as the visual support of the analyses.
Essentially, it shows:
- Which clusters were merged.
- The distance between them.
- How the structure changes as you go up the hierarchy.

Linkage Methods
The linkage method specifies what to do when merging two preclusters:
- Single Linkage – Closest pair between clusters.
- Complete Linkage – Farthest pair between clusters.
- Average Linkage – Average distance between all points.
- Ward’s Method – Minimizes variance within clusters (best for compact clusters).
![]() Join Our Data Science Telegram Channel
Join Our Data Science Telegram Channel
![]() Join Our Data Science WhatsApp Channel
Join Our Data Science WhatsApp Channel
Hierarchical Clustering Example in Real Life
Example: A bookstore prefers to group customers by preferences.
Steps:
- Analyze purchase history.
- Calculate similarity in buying behavior.
- Apply agglomerative hierarchical clustering.
- Identify clusters as ‘Fiction Lovers,’ ‘Textbook Buyers,’ and ‘Mixed Readers.’
Advantages
- No need to predefine the number of clusters.
- Can be used for various types of data.
- Produce visuals with a dendrogram.
- Easy to interpret with little or medium data.
Disadvantages
- Not good for very large datasets.
- Sensitive to outliers.
- Clustering that has been combined or split can never be undone.
When to Use Hierarchical in Machine Learning
- When data is small to medium.
- When visual explanations are needed.
- When the number of clusters is unknown.
Python Implementation of Hierarchical Clustering
from sklearn.cluster import AgglomerativeClustering
from scipy.cluster.hierarchy import dendrogram, linkage
import matplotlib.pyplot as plt
# Sample Data
data = [[1,2],[2,3],[5,6],[6,7]]
# Linkage Matrix
linked = linkage(data, method=’ward’)
# Plot Dendrogram
dendrogram(linked)
plt.show()
# Agglomerative Clustering
model = AgglomerativeClustering(n_clusters=2, linkage=’ward’)
labels = model.fit_predict(data)
print(labels)
Industry Case Studies
- Retail – Grouping shoppers for targeted marketing.
- Healthcare – Classifying patients by symptoms.
- Finance – Segmenting investors by portfolio type.
- Social Media – Grouping users by content engagement.
Common Mistakes to Avoid
- Skipping data standardization.
- Choosing the wrong linkage for the data type.
- Ignoring outlier handling.
Also Read:
- What is K Means Clustering? An Effective Guide with Examples (2025)
- What is Gradient Descent? A Beginner Guide to the Learning Algorithm
- Data Labeling: What It Is, How It Works, and Why It Matters in 2025
- Data Lake Explained: An Effective Beginner Guide to Smart Data Storage
Master-level knowledge on hierarchical clustering
Hierarchical clustering offers a pictorial treat and one of the most insightful clustering techniques in machine learning. The knowledge of such types, methods, and applications lets you see through patterns of data where a democratized clustering method may fail to grasp.
If you wish to get into the master of this clustering or any other machine learning techniques, please join PW Skills’s Data Science Course. Learn from industry experts, work on real datasets, and build a portfolio that gets noticed. Your journey from beginner to professional starts here.
Hierarchical Clustering FAQs
Can hierarchical clustering be used for image recognition?
Yes, it groups images with similar features, making it useful in image segmentation tasks.
Is hierarchical clustering better than K-means for small datasets?
Yes, because it doesn’t require predefined clusters and provides better visual interpretation.
Can I combine hierarchical clustering with other algorithms?
Yes, you can use it for initial grouping and then refine clusters using K-Means.
What’s the best linkage for market segmentation?
Ward’s method is often preferred, as it creates compact, well-separated clusters.

