Exploratory Analysis is an important step in the process of data analysis, as it helps to understand various datasets better. If you understand the data clearly, then only you can choose the best modeling techniques to get the best results.
In this blog, we will talk about Exploratory Data Analysis in detail, including its different types, importance, and how to perform Exploratory data analysis. Continue reading to learn everything about Data Exploratory Analysis.
What Is Exploratory Analysis?
Exploratory Data Analysis is basically used for summarizing all the data before actually starting modeling. Data science and analysis is a vast field, and one of the most important areas it includes is the Exploratory Data Analysis. It helps you in various ways, like:
- To understand the data better by presenting it in a visualized form
- To find out different patterns to understand how different paths of data are connected.
It is done by using various tools, and the tools vary based on the software or programming language. Let’s have a look at some of the tools used in the most common programming languages: Python and R.
- In Python, Pandas is used to clean and manipulate data, whereas in R, dplyr is used to manipulate data.
Why Is The Exploratory Data Analysis Important?
By now, you might have understood that exploratory data analysis is one of the most important parts of data science and analytics. But now you might have a question: why is it so?

Well, exploratory analysis helps us with so many things while analyzing data. Some of the key factors why it is considered an important part of data science and analytics are listed below. Check them out.
- Exploratory analysis helps us to identify the features of a dataset.
- It helps us to identify hidden patterns and relationships between various data points.
- It even helps us in identifying errors and unusual data points.
- It helps us to understand data structures in a better way. If you understand the data well, then you can choose the best modeling techniques to analyse and interpret valuable insights from it.
Read More: Top 10 Datasets for Data Science Projects
Exploratory Data Analysis Language
The two basic and most used programming languages are Python and R. Let’s check which tools are used to create an exploratory analysis in these two languages.
1. Python
Python and Exploratory analysis are used together to identify missing values in a dataset. It is one of the most important parts because this will help to make decisions on how to handle missing values for machine learning. In Python:
- Pandas is used to clean and manipulate data
- Matplotlib is used to add visualizations that make the data visually appealing
- Seaborn is used to make the data more attractive.
2. R Language
R is a programming language that is most commonly used to develop statistical observations and analyse data. In R:
- ggplot2 is used to create complex plots
- dplyr is used for data manipulation
- tidyr is used to organize the data.
Different Types Of Exploratory Analysis
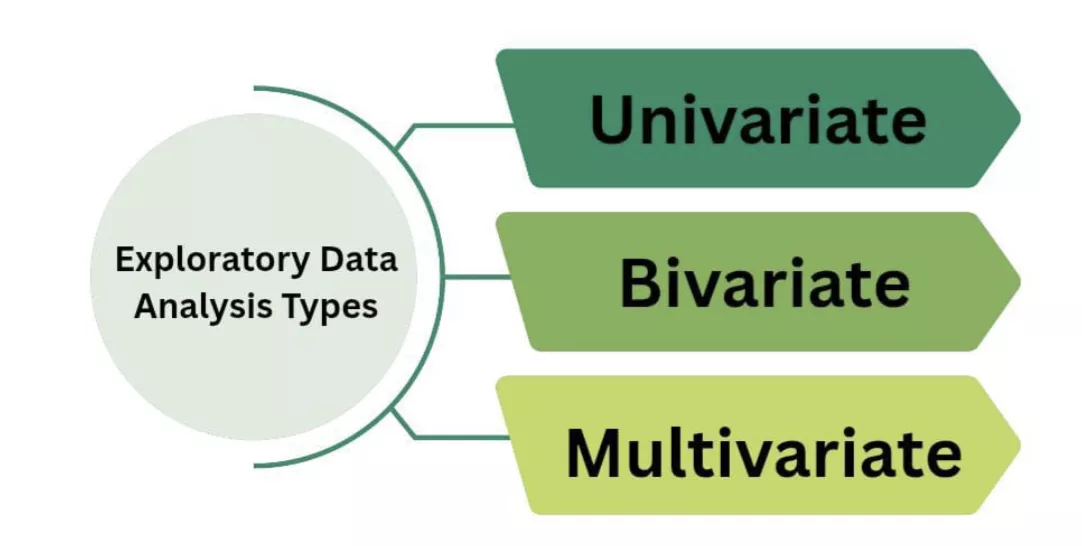
There are mainly three types of Exploratory Data Analysis. If you are interested in learning the concepts of data science, then it is important to understand Exploratory analysis in detail.

Check out the three different types of Exploratory Analysis below.
1. Univariate Analysis
Univariate analysis focuses on just one variable at a time. The main task is to understand the characteristics of a variable. Some of the most common methods, like histograms, box plots, and bar charts, are used to show data distribution, detect outliers and categorise data, respectively.
2. Bivariate Analysis
As the name suggests, Bivariate analysis focuses on understanding the relationship between two variables. It is used to find the connection, correlation, and dependencies of the variables. Basically, by bivariate analysis, you understand how the two variables interact with each other.
3. Multivariate Analysis
Multivariate Analysis is an analysis that focuses on two or more variables. Multivariate Analysis helps you to understand the relationship between the variables and understand how they interact with each other, which is important to understand for data modeling.
Read More: 7 Affordable Business Intelligence Software Programs for Data Analysis
How To Perform Exploratory Data Analysis?

You might be thinking that we talked about what Exploratory analysis is and why it is important, but what about how to perform Exploratory data analysis? Well, don’t worry. The most important part of understanding Exploratory analysis is its process. So check out the step-by-step procedure to perform exploratory data analysis.
Step 1: Understand the problem
Let’s start the Exploratory Analysis Process. The first thing that you’ll do is to understand the problem that you need a solution for, and understand the data that you have available. It is the first and most important step because this will give you a direction to walk on and perform further steps.
- What is your business goal or objective?
- What are the variables used for representation?
- What are the major types of data used?
- Are there any limitations or quality issues?
This stage makes you informed about the issues and problems within the data, which you can use to avoid incorrect conclusions or assumptions in later stages.
Step 2: Import the Data
Importing the data basically means adding all of the data that you have to your system. It can be in the form of an Excel sheet, SQL database, or even APIs. You can upload all of the data so that it becomes easier to organise it in a well-structured manner and perform the analysis.
- Load the data into the environment carefully while avoiding frequent errors.
- Handle missing values promptly within your data, as it might impact the quality of your analysis.
- Keep yourself well informed about the size of the data to better understand and interpret its complexity.
- Identify the type of data, as it will help you in analysis and data manipulation
- Find errors or anomalies in data and fix them before they become major issues.
Step 3: Handle missing data
When you upload the data, you will notice some missing values. Well, you don’t have to worry at this point. It is completely normal to notice a few missing values in the data, the more important part that you can actually think about is how you will handle those missing values.
You can either choose to remove the missing values or fill in the missing values. There are many imputation methods, like regression, imputation, mean, median, KNN, decision trees, and more, which can help you in handling missing data.
Step 4: Understand Data characteristics
Now, the next step in the Exploratory analysis process is to understand the data you have. Make sure that you are familiar with the data you will work on. Have a look at the number of rows and columns. Also, notice which type of data you have.
Step 5: Data Transformation
Data transformation is the next step in the process of Exploratory Analysis. After understanding the data, you have to organise it in such a way that it is easier to read and perform analysis.
The more structured data will be easier to analyse as compared to a complex sheet of data.
Step 6: Data Visualization
When you organise your data, it is important to turn your boring tables into a visually appealing form so that it is easy to understand. You can use charts and graphs to make it better. It will help you to easily understand trends, patterns, and the relationship between different variables in exploratory analysis.
There are various tools available that you can use, like Matplotlib, Seaborn, or Power BI, to turn your boring data into well presented data.
Step 7: Handle Outliers
Now, the last step is to check for outliers. This is a step that shouldn’t be ignored. It can mess up your analysis if not properly treated. You can cap them, remove them, or transform the data during exploratory analysis.
Read More: Outliers and Outlier Detection &How To Conduct Outlier Detection In A Dataset? [2025]
Start Upskilling With PW Skills
Prepare yourself for a wide range of career opportunities in the field of data analysis with the PW Skills Data Analysis Course. The program is well equipped with live sessions, recorded sessions, interactive coursework, real world projects, assessments, quizzes, doubt sessions, and more.
Complete the entire program and get an industry recognised certification from PW Skills. Build your knowledge and gain exposure.
Exploratory Analysis FAQs
Q1. What is the purpose of Exploratory analysis?
Ans: The Exploratory Data Analysis is actually used to understand the structure of a dataset, along with its patterns and characteristics to identify anomalies before you perform data modeling.
Q2. What are the three types of EDA?
Ans: There are mainly three types of EDA (Exploratory Data Analysis), they are:
1. Univariate: It focuses on only one variable.
2. Bivariate: It focuses on identifying the relationship between two variables.
3. Multivariate: It focuses on identifying the relationship between two or more variables.
Q3. Are EDA and ETL the same?
Ans: No. EDA refers to Exploratory Data Analysis and ETL refers to Extract, Transform, Load.
1. EDA is used to collect and summarise data to gain valuable insights.
2. ETL is used to extract, transform and load data in systems.
Q4. Which tools are most commonly used for EDA?
Ans: The most commonly used tools for EDA depend on the programming language that you are using.
For Python, the following tools are mostly used:
1. Pandas
2. Matplotlib
3. Seaborn
And for R, the following tools are mostly used:
1. ggplot2
2. dplyr
3. tidyr.

