Skewness and Kurtosis are two of the major statistical measures used in analysing the data. Both these metrics are used to determine the shape of the distribution and get more information in hand.
Skewness measures the degree of symmetry or the lack of symmetry. Kurtosis refers to the data that is long tailed or heavy-tailed when compared to the normal distribution. Let us understand the main differences between skewness and kurtosis.
What Is Skewness?
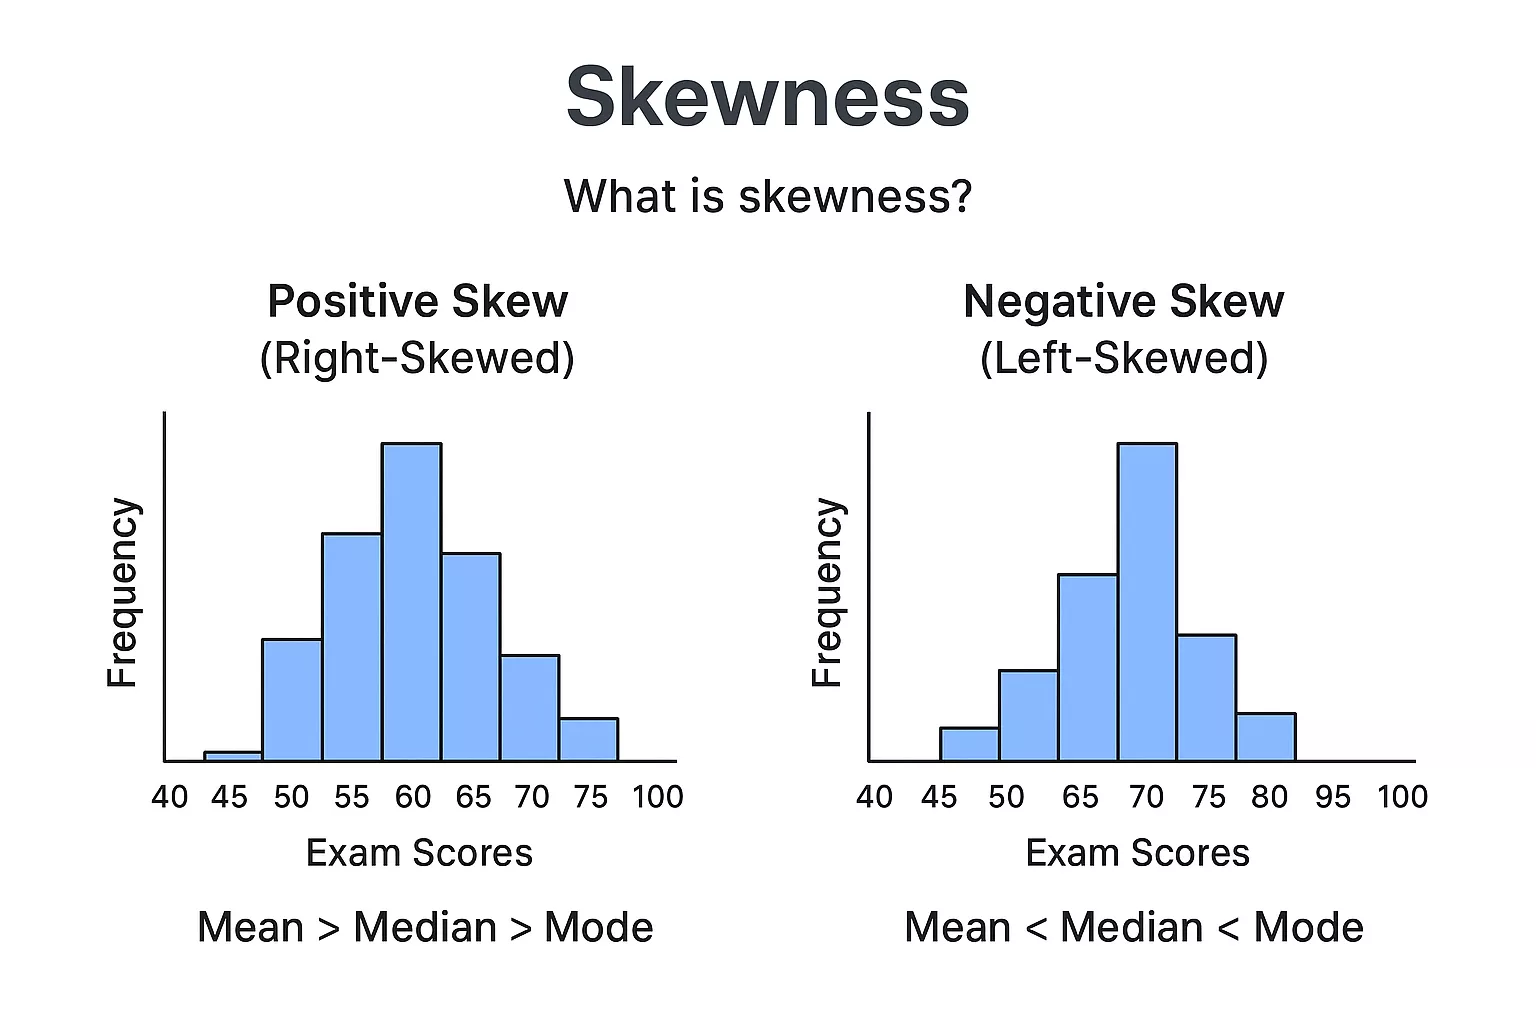
Skewness is a metric in statistics that is used to describe the symmetry or lack of symmetry in the complete data distribution. The distribution of a graph may shift on any side i,e. Either left or right. Check the following image given below.

Types of Skewness
Check the major types of skewness used in statistics normal distribution is defined below.
1. Symmetrical
Symmetrical distribution in Skewness is a condition where the frequency distribution is the same on both sides of the frequency curve. This conveys that there is no skewness in a perfectly symmetrical frequency distribution.
| Mean = Median = Mode |
Read More: Data Collection: 6 Essential Steps, Key Methods, and Top Tools
2. Asymmetrical Skewness
The asymmetrical skewness is a condition in a frequency distribution where the distribution is not consistent or the same on both sides of the center point of the frequency graph. The curve can be stretched more to the right or left side. Based on which side the curve of frequency distribution is stretched, it is further classified into two types.
- Positive Skewness
- Negative Skewness
What Is Positive Skew And Negative Skew?
There are two major types of skew, which are defined based on the distribution. Check below.
Positive Skew
The left side graph shows that the graph is right-skewed, which means the graph is stretched to the right. It is also known as Positive Skew. It pulls the meand upward. The relationships used to represent these right-skewed metrics are given below.
| Mean > Median > Mode |
Negative Skew
In this type of graph, the tail of the graph stretches to the left side, where most values are on the higher side, pulling the mean downward.
| Mean < Median < Mode |
What Is Kurtosis?
Kurtosis is a statistical distribution metric that tells about the shape of a distribution. It measures the degree of peakedness of a distribution. The value of a kurtosis can range from – (∞) to + (∞).
With the help of the kurtosis representation, you can understand how heavy or light the tail of a distribution keeping. Let us understand the Kurtosis formula below.
 |
n = number of observations
Types of Kurtosis
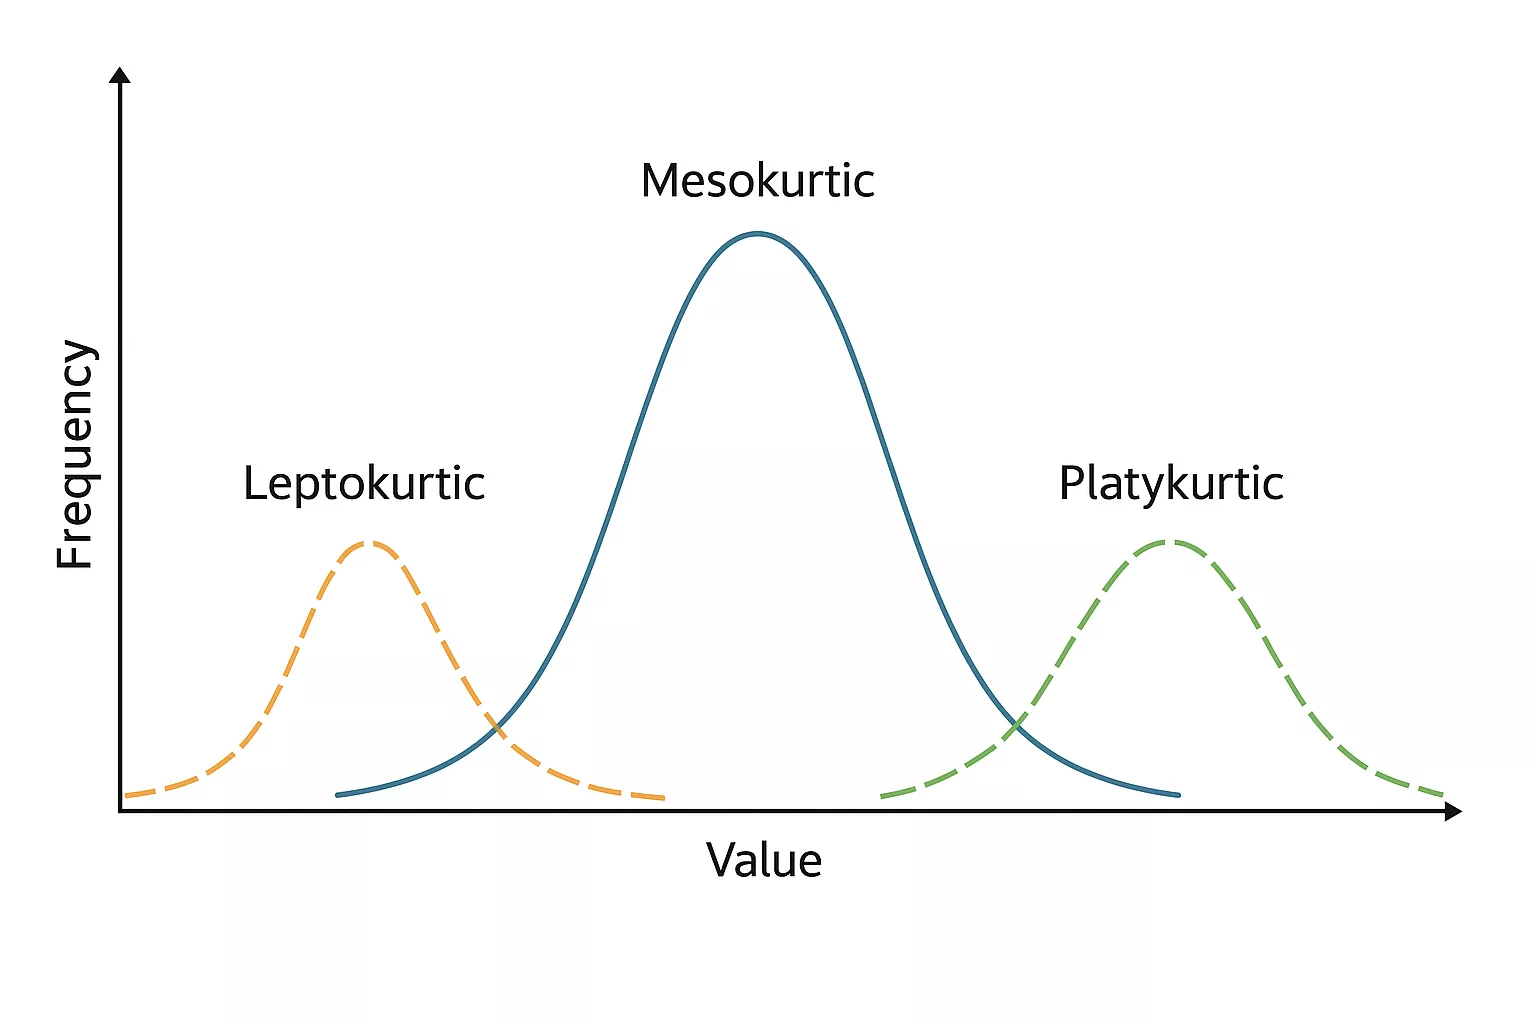
There are three major types of Kurtosis, which we are going to learn below.
| If Kurtosis > 0, then it is Leptokurtic
If Kurtosis = 0, then it is Mesokurtic If Kurtosis < 0, then it is Platykurtic |

- Mesokurtic: Mesokurtic is a curve with a normal peak than the normal frequency distribution. Here, most items contain an equal distribution of items around the central value. In the case of the Mesokurtic Kurtosis, there is a normal distribution share that can be used as a baseline. These are normal tails for a moderate peak.
- Leptokurtic: In Leptokurtic, you get a higher peak when compared to a normal distribution. This tells there are more outliers containing extreme values. Here, most items are concentrated near the center level.
- Platykurtic: In Platykurtic, you get a lower peak than the normal curve. In the case of Platykurtic, they get a flatter peak and thinner tails than normal, which indicates fewer outliers and more evenly spread data.’
Why are Skewness And Kurtosis Important For Statistical Models?
Skewness and Kurtosis are major factors when determining the accuracy and reliability factors in statistical models. When there is high skewness or kurtosis in a given set of data, it could violate the conditions of normal distributions, affecting the mean and variance, which might create inefficient and faulty results.
Also, model assumptions become important when there is skewness and high kurtosis present. Some major common transformations include, square root, logarithmic, inverse transformation, and more. Skewness and Kurtosis are factors that might help you in choosing the required statistical model for your given set of data.
Skewed data can also create biased model training for outliers, as high-priced homes can dominate the complete model behavior. When you know the skewness factor, you can choose a data transformation accordingly, such as the square root, Box-Cox transformation, and more.
Read More: What Are Some Common Statistical Measures In Data Analytics?
Formula To Calculate Skewness and Kurtosis
You can calculate skewness and kurtosis for the set of data you need.
1. Skewness
The formula for calculating Skewness is given below.
| Skewness = E[((X – µ) / σ)^3] |
Here,
X = each value given in the mean
µ = mean
σ = Standard deviation
E = Expectation operator
Read More: The Life Cycle of a Data Science Project: From Idea to Impact Effective Guide (2025)
2. Kurtosis
You can calculate using the same formula, only the deviations are raised to the power of 4. Extreme values get more weight using this metric. Here, excess kurtosis is calculated by taking the difference of kurtosis by 3.
| Kurtosis = E[((X – µ) / σ)^4] – 3 |
Where,
X = each value given in the mean
µ = mean
σ = Standard deviation
E = Expectation operator
Difference Table Between Skewness And Kurtosis In Data Analysis
Skewness and Kurtosis share major differences between each other.
- Skewness is used to measure the degree of asymmetry, while kurtosis measures the degree of flatness or peakedness of a distribution.
- Skewness is the third measure of moments, while kurtosis is the fourth measure of moments.
- The value of skewness and kurtosis lies in the range of -infinity to +infinity.
- Skewness and kurtosis both describe the shapes of the frequency distribution.
- Skewness affects the center of the frequency distribution, while kurtosis affects the tails of the distribution.
Check the major difference table between skewness and kurtosis in the table given below.
| Skewness | Kurtosis |
| Skewness is a metric used to measure the degree of symmetry of a frequency distribution | Kurtosis is used to measure the peak value a distribution can achieve. |
| It depicts the shape and size of variation on both sides of the central value on the distribution graph. | It shows the concentration of items in the central part of the distribution. |
| It shows whether the data leans more to the left or right of the mean value. | It shows whether the data is heavy or light outliers. |
| It focuses on the direction of the spread of data. | It focuses on the shape and tail thickness of the frequency distribution. |
There are three main types of skewness
|
There are three main types of kurtosis
|
| It changes the direction of the curve. | It changes the height and thickness of the curve. |
| When its value is 0, then it is said to be perfectly symmetrical. | When its value is 3, it represents a normal distribution. |
| It shows the imbalance existing within the set of data. | It shows the concentration of data around the mean and outliers. |
Read More: Important Application of Data Science in Various Fields: 30 Topmost Applications
Examples of Skewness and Kurtosis
Let us take a simple example for both Skewness and kurtosis metrics below.
Skewness Example
Let us take an example of the income distribution of a population where most people earn moderate incomes for their livelihood, while a few people earn very high salaries, which pulls the tail to the right.
For example, when the median is ₹50,000 and the Mean is ₹80,000, then it is right-skewed data
Kurtosis Example
You can take the example of daily returns registered in the stock market, where returns often have heavy tails because of the extreme ups and downs when compared to a normal distribution. When kurtosis is higher, the peak you get is sharper.
Master Data Science With PW Skills
Build your Data Science skills with this 6 month complete Data Science with Generative AI Course suitable for everyone i,e. Beginners as well as professionals. The course offers in-depth learning modules with live sessions, practice exercises, hands on exercises, and more.
Get career support from our dedicated mentors and build your job ready portfolio after completion of course. You will also get industry recognised certification from PW Skills after completing your course.
Difference Betweeen Skewness And Kurtosis FAQs
Q1. What is skewness?
Ans: Skewness represents a statistical technique used to determine the symmetrical orientation of data in a frequency distribution graph. When there is a lack of symmetry, it can tail on either side i,e. Left or right.
Q2. How many types of skewness?
Ans: Positive skewness and negative skewness are two major types of skewness in statistics.
Q3. What is zero skewness?
Ans: Zero skewness is a condition where the data in a frequency distribution is perfectly symmetric i,e. Neither to the left nor to the right. Mean, median, and mode lie at the center of the zero skewness.
Q4. What is good skewness?
Ans: Skewness means that the distribution of data is close to symmetry without lying either on the left or the right side.
Q5. What is the difference between skewness and kurtosis?
Ans: Skewness is a metric used to measure the degree of symmetry of a frequency distribution. Whereas, kurtosis describes the peak or flatness of the frequency data distribution.

