In Today’s data-driven world, managing and organizing data has become very important, especially when the data is large and complex. This is where data handling comes into action.
Data handling is the process of managing the gathered data properly during and after a project. It involves performing several steps for securely storing, archiving, or getting rid of complex data. This can be done both electronically and manually to keep the data safe and secure at all times.
Data handling is useful not just in Math and Science, but in any field that needs to show data in a meaningful manner. Today, in this article we will be talking about what data handling is, what are the types of data handling and why is it important for businesses.
Data Handling – Key Takeaways
- Data handling involves collecting, managing, and presenting data for easy analysis.
- Common types of data handling include pictographs, bar graphs, line graphs, pie charts, and scatter plots.
- Data handling basically organizies complex data clearly, enhances decision-making, saves time, ensures data security, enable data sharing, and helps in scalability.
- Tools used for data handling include spreadsheets, database management systems, data visualization tools, ETL tools, programming languages, and big data tools.
What Is Data Handling?
Data handling is a process of collecting, recording, and presenting information in a way that makes it easy to analyze for businesses and individuals. In data handling, Data is usually represented using visuals like pictographs, bar graphs, pie charts, histograms, and line graphs. Each of these visuals serves for a different purpose.
Do you remember how we learned about the composition of air in our science class, that was an example of how complex data can be organized in an understandable manner.
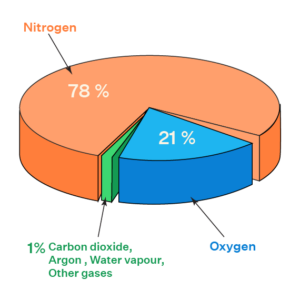
The constituents of air are shown with different colors in a pie chart, making it easy to understand. But, do you believe that other charts like bar graphs or line graphs would be able to show this information as clearly as the pie chart does? This shows that each type of data handling has a specific purpose, and by learning about them, you can choose the best one for your needs.
Steps Involved In Data Handling Process
The data handling process involves several key steps that are performed in a sequential manner to get the best possible results. Let us see the different steps involved in the data handling process that will help you to understand this topic more clearly.
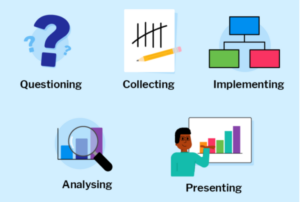
- Purpose: The very first step is to clearly state the problem or purpose of performing data handling. This step helps in understanding what needs to be solved or achieved.
- Data Collection: After understanding the purpose of performing data handling, the next step is to gather the information that is important and related to the purpose.
- Presenting Data: In this step, the gathered data is then organized into a simple and easy-to-read way, like a table or with tally marks.
- Graphical Representation: Now, the charts or graphs are being used to show the data in a visually attractive manner. This makes it easier to spot patterns and understand the information quickly.
- Data Analysis: Here, the Data analysts and other stakeholders. Examine the data closely to find useful insights or important details that can help in making decisions.
- Conclusion: At last, based on the data analysis, people provide a solution or answer to the problem.
Graphical Representation of Data Handling
Data handling can be represented in plenty of graphical ways, here is a list of some commonly used graphical representations for handling data in a meaningful manner.
- Pictographs
- Bar Graphs
- Line Graphs
- Pie Charts
- Scatter Plot
Let us understand each one of them clearly and see which one should be used for where.
1. Pictograph
A pictograph is a way of showing information using pictures. Instead of using words or numbers, we use images to make the data easier to understand. A long time ago, people used pictures to communicate because languages didn’t exist, making pictographs can be considered as one of the oldest forms of communication.
Even today, pictographs help us in our daily lives. For example, when a friend tells us a story, we imagine it in our minds, which makes the story easier to follow and remember. Let us understand it in a more better way with the help of an example
Example Of Pictograph:
In a school sports event, three students participated in a running competition. Aman ran 5 laps, Riya ran 3 laps, and Neha ran 4 laps. Let us create a pictograph to show this information.
Here are the simple steps that you will follow to create a pictograph:
- Choose a picture to represent the data: Pick a symbol related to the activity, like a running shoe to show how many laps each student ran.
- Draw the pictures to match the data: Use the chosen picture to represent the laps. For example, Aman will have 5 running shoes because he ran 5 laps, Riya will have 3 shoes for her 3 laps, and Neha will have 4 shoes for her 4 laps.
2. Bar Graph
A bar graph is a way of showing numbers or data using bars. It makes the data look neat and clear, making it easy to understand. Bar graphs also make it simple to compare different pieces of data in one place.
There are two types of bar graphs that are commonly used to represent data, these include:
- Vertical Bar Graph
- Horizontal Bar Graph
Bar Graph Example
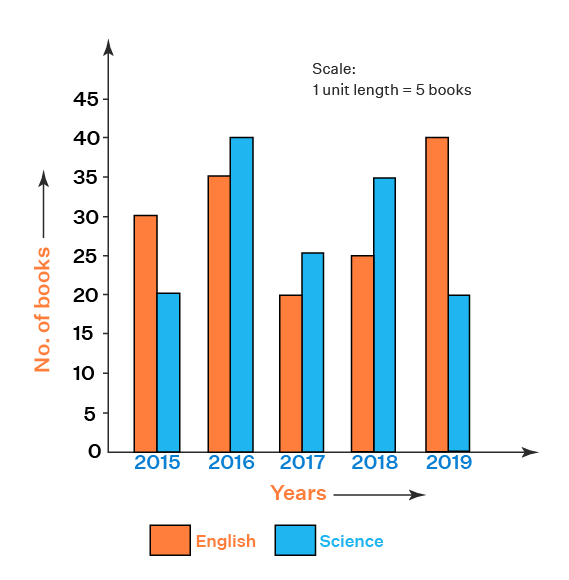
Let us understand this in a better way, with the help of an example- suppose, you want to compare the number of English and science books sold in different years, you can use a vertical bar graph where each bar represents a year, and the height of the bar shows how many books were sold. This makes it easy to see which year had the highest or lowest sales.
3. Line Graph
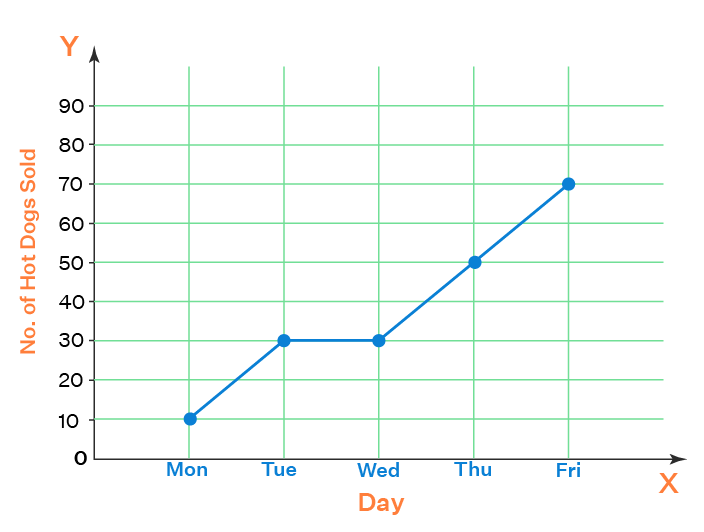
In data handling, a line graph is used to show data as a line on a chart. This graph helps to display changes or trends in the data over time. The line is made by connecting different data points on the graph which makes it easy to analyze data in a more clear way.
Example Of Line Graph
Suppose, we want to track the number of dogs sold in a particular city each day for a week, we can plot the number of dogs sold on the graph. Then after that by connecting the points, the line shows how the sales went up or down during the week.
4. Pie Chart
A pie chart is a circular graph that shows how different parts make up a whole thing. Each section of the pie chart represents a portion of the total, and the size of each slice shows how much it contributes compared to the others.
Pie charts are often used to show the breakdown of data in percentages or proportions. They are helpful when you want to compare parts of holistic data, such as the market share of different companies, the budget distribution in a project, or survey results.
Example Of a Pie Chart
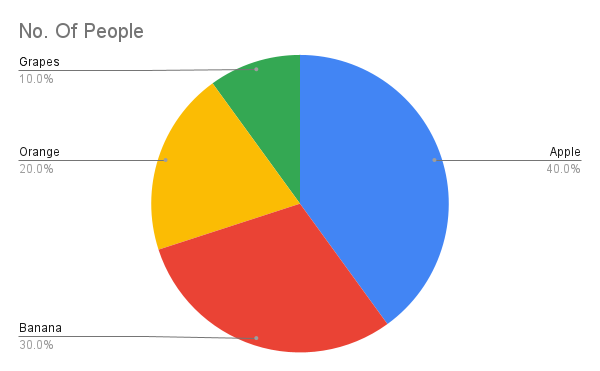
Imagine you conducted a survey asking 100 people what their favorite fruit is. The results are:
- 40 people like apples
- 30 people like bananas
- 20 people like oranges
- 10 people like grapes
Now, to represent this information in a visually appealing manner, You can use a pie chart. The largest slice would represent apples (40%), followed by bananas (30%), oranges (20%), and grapes (10%). This makes it easy to see which fruit is the most popular.
5. Scatter Plot
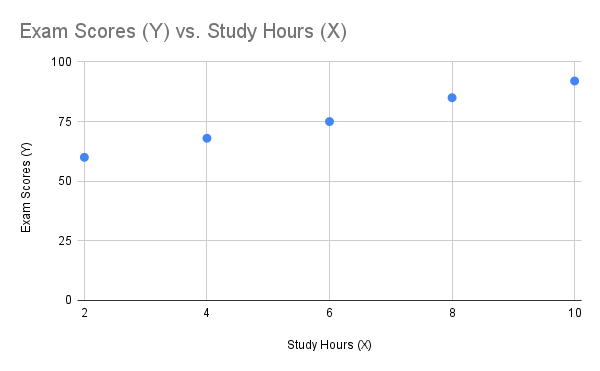
A scatter plot is a type of graph which is used to display the relationship between two sets of data. It shows individual data points on a graph, where one variable is represented on the x-axis and the other on the y-axis. Each dot on the scatter plot represents one data point. It is often used to see if there is a pattern or correlation between the two variables.
Scatter plots are commonly used in statistics and data analysis to understand trends, patterns, or connections between data points. For example, it can help determine if increasing study hours leads to better exam scores.
Example of Scatter Plot:
Imagine we want to see if there is a connection between the number of hours students study and their exam scores. We can plot study hours on the x-axis and exam scores on the y-axis. Each student’s data would be a dot on the graph. If the dots tend to move upward from left to right, it shows that more study hours might lead to better scores.
| Study Hours (X) | Exam Scores (Y) |
| 2 | 60 |
| 4 | 68 |
| 6 | 75 |
| 8 | 85 |
| 10 | 92 |
Advantages In Data Handling
Data handling provides plenty of advantages to businesses, let us look at some of the common advantages in Data handling, that make it popular among businesses:
- Improves Organization: Data handling helps you to organize large amounts of information in a structured way, making it easier to find and use when needed.
- Enhances Decision Making: With well-managed data, you can make better and more informed decisions because the data is accurate and up-to-date.
- Saves Time: When data is properly handled, it becomes easier to process and retrieve which significantly saves time that would otherwise be spent searching for the right information.
- Supports Data Security: Effective data handling includes measures to protect sensitive information from unauthorized access, keeping data safe and secure.
- Facilitates Data Sharing: Well-organized data can be easily shared across teams or departments, which improves collaboration and communication.
- Helps in Scalability: As the amount of data continues to grow daily, good data handling practices allow you to manage and scale the data without losing efficiency or accuracy.
Data Handling Tools
The data handling process requires the use of plenty of tools and software, where each data handling tool is used for different purposes. Let us look below to understand the usage of each data handling tool in brief:
- Spreadsheets (Excel, Google Sheets): These are commonly used tools for organizing, storing, and analyzing small to medium-sized data sets with functions like sorting, filtering, and basic calculations.
- Database Management Systems: These tools like – MySQL and PostgreSQL help in managing large amounts of data by storing it in structured tables, allowing easy access, modification, and querying of the data.
- Data Visualization Tools: Tools like Tableau and Power BI help in transforming data into visual formats like charts, graphs, and dashboards, making it easier to understand patterns and trends.
- Data Cleaning Tools: Tools like OpenRefine and Trifacta help in cleaning and preparing raw data by removing errors, duplicates, or inconsistencies, ensuring that the data is accurate and ready for analysis.
- ETL Tools: ETL which basically means – Extract, Transform, and Load are performed by tools that help in extracting data from various sources, transforming it into the desired format, and loading it into a target system like a data warehouse.
- Data Warehousing Tools: These tools like Amazon Redshift and Google BigQuery store vast amounts of data in a central repository, making it easy to access and analyze large datasets quickly.
- Programming Languages: Languages like Python and R are powerful programming languages used for data analysis, manipulation, and handling of complex data tasks like machine learning, statistical analysis, and data visualization.
- Data Mining Tools: Tools like RapidMiner and KNIME help in analyzing large datasets to uncover hidden patterns, trends, and insights that can be used to make data-driven decisions.
- Big Data Tools: Tools like Hadoop and Apache Spark are designed to handle and process extremely large datasets across multiple computers, allowing for fast analysis and handling of big data.
Learn Data Handling With PW Skills
Are you an individual looking to start your career as a proficient data analyst?
If yes, then enroll in our comprehensive Data analytics course to start your journey with us in a beginner-friendly manner.
Enrolling in this course will provide you with features like- mentorship from experts, daily practice sheets, regular doubt sessions, 100% job assistance guarantee, networking opportunities, alumni support, easy EMI options on course fees, and much more.
So, what are you waiting for? Visit PWSkills.com Enroll today and grab your seat on this journey of success.
Data Handling FAQs
Why is data handling important?
Proper data handling ensures data accuracy, security, and accessibility, which is crucial for making informed decisions and maintaining data integrity.
What are the methods of data handling?
Common data handling methods include sorting, filtering, grouping, summarizing, and visualizing data for easy interpretation and analysis.
What tools are commonly used for data handling?
Popular data handling tools include Excel, SQL, Python with pandas, R, and cloud-based platforms like Google Cloud and AWS for large-scale data management.


