There are many data analysis and techniques mentioned in research, PDF, and examples of notes online. We will go through various data analysis examples and data analysis processes to throw some light on these data analysis and techniques extensively being used to make research papers, PDFs, and more.
In this tutorial blog, we will learn more about different data analysis and techniques used in the industry. There are many data analysis and techniques in research and qualitative research that can help us explore more on the topic.
Also Read 💡 : Deutsche Bank Internship in India: Role, Eligibility, Stipend 👈
What is Data Analysis And Techniques?
Data Analysis is the process of preparing, examining, organizing, and interpreting raw data to uncover meaningful patterns, trends, and insights from the data.
The complete data analysis and techniques involve cleaning, data transforming, and modeling data to make it useful for making decisions, problem solving, and generating predictions. There are multiple data analysis and techniques that can be used in the organization to boost its operations.
Also, check Data Analysis and AI Tools in 2024
Common Data Analysis and Techniques
Check out some of the best data analysis techniques given below.
1. Descriptive Analysis
Descriptive Analytics technique focuses on summarizing past data. For example, averages, percentages, bar charts, histograms, etc. The past data can be used to understand how a business changed over the course of time.
- Frequency disruption is the most basic method to determine the disruption of variables.
- The central tendency of disruption which is also known as three Ms is used to determine the number of most represented values used with a single variable against all other data. The mean, median and mode are frequently used in the central tendency method.
2. Exploratory Data Analysis (EDA)
Exploratory Data Analysis (EDA) involves investigating datasets to find patterns, anomalies, or relationships using graphical and statistical tools. Example: Understanding factors contributing to high employee turnover.
3. Inferential Analysis
Inferential analysis uses statistical models to make predictions or inferences about a population based on sample data. Example: A/B testing to determine the effectiveness of marketing strategies.
-
- T-test is commonly used to test a hypothesis in comparison to the mean or averages between the groups.
- Analysis of Variance (ANOVA) is more efficient and decreases the experiment-wise error as well as the chances of varying results.
- Chi-square is also used to detect the relationship between the categories of two variables.
4. Predictive Analysis
Predictive analysis employs machine learning or statistical methods to predict future trends. It can forecast future outcomes based on statistics and modeling techniques. For Example, Forecasting sales using historical data.
5. Prescriptive Analysis
Prescriptive Analytics is used to Suggest an action based on predictive insights. For example, we recommend optimal inventory levels based on demand predictions.
6. Text Analysis
Text analysis extracts meaningful information from text data using natural language processing (NLP). For Example: Sentiment analysis of customer reviews.
7. Time Series Analysis
Time series analysis focuses on analyzing data points over time to identify trends or seasonal effects. For Example: Stock price forecasting.
8. Cluster Analysis
Cluster analysis is used to group data points with similar characteristics. For example: Customer segmentation in marketing campaigns.
9. Explanatory Analysis
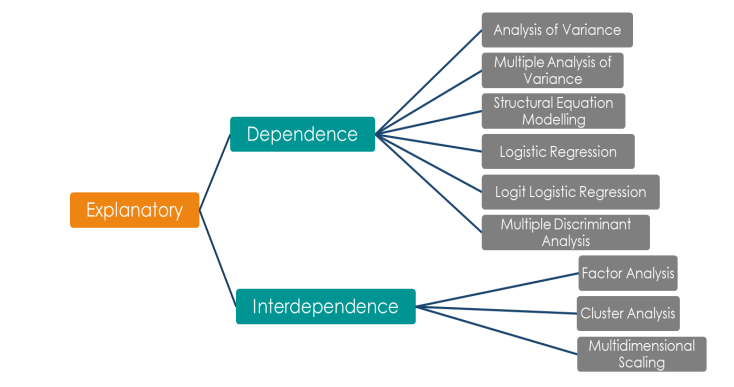
Explanatory analysis finds connections, relations, and patterns between variables. The main explanatory analysis techniques are dependence and independence methods.

The dependence method is concerned with predictor variables while the independence method determines the interrelationships between the variables with no assumption for the influence direction.
Data Analysis and Techniques References
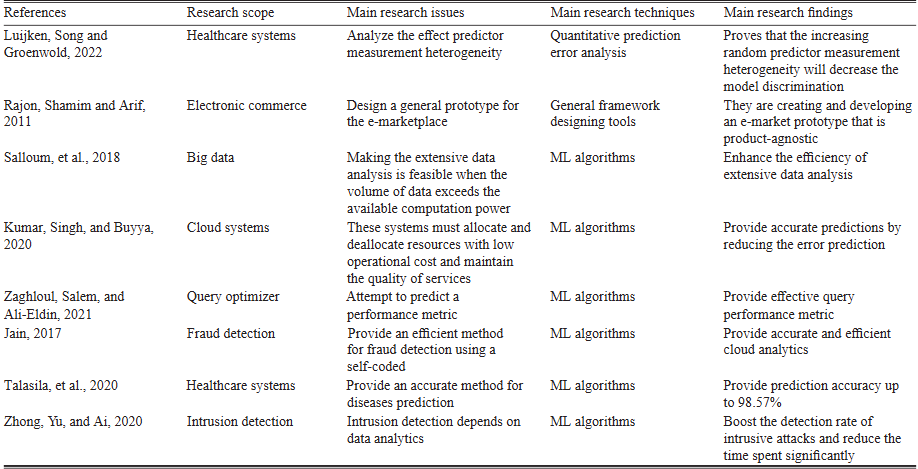
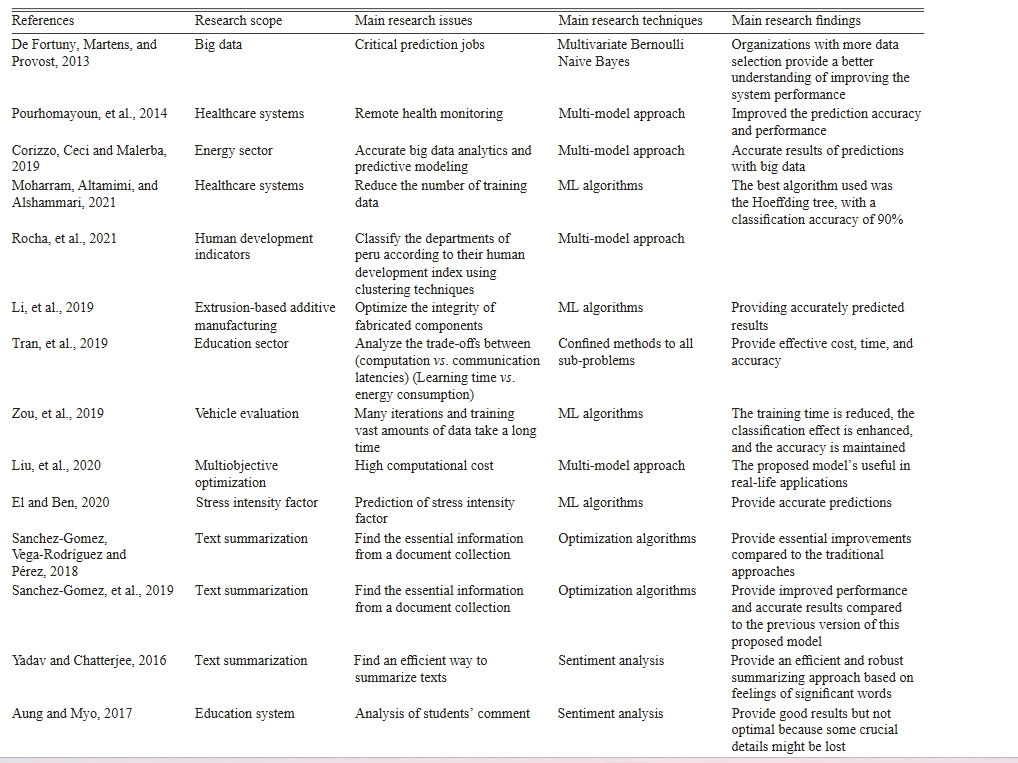
You can find a lot about data analysis techniques in research references on Kaggle, ResearchGate, etc. These references talk about some of the best techniques and findings in some research.


These research findings can help us guide some of the best data analytics and techniques that can be developed in the coming stages. Also, the impact of machine learning algorithms and multi-model approaches are broadly discussed in the research findings.
Factors to Consider in Data Analysis and Techniques
Data Analysis is a crucial process that must be thoroughly studied and practiced before implementation. Check some of the important steps to consider before performing data analysis and techniques.
- Clear Objective: Clearly define the purpose and goals of the analysis. For example: You must be clear on the point, whether you are identifying trends, making predictions, or solving a specific problem?
- Data Quality: Make sure the data is accurate, complete, and consistent. Also, handle missing or duplicate data effectively.
- Data Relevance: Use data relevant to the problem at hand to avoid unnecessary complexity.
- Sampling: Ensure the data sample is representative of the population. Avoid sampling bias to ensure generalizable results.
- Data Type and Structure: Understand whether the data is structured (e.g., spreadsheets) or unstructured (e.g., images, text). Use appropriate tools and techniques for each data type.
- Statistical Significance: Ensure the results are statistically valid and not due to random chance.
- Visualization: Use clear and meaningful visual representations to interpret data effectively. Example: Line charts for trends, scatterplots for relationships.
- Scalability: Ensure the analysis approach can handle large datasets if required.
- Ethical Considerations: Address privacy and security concerns. Ensure transparency and fairness in analysis, avoiding biased conclusions.
- Tools and Technology: Choose the right tools (e.g., Excel, Python, R, Tableau) based on the complexity and type of analysis.
Data Analysis and Techniques Example
We can collect customer databases and feedback logs to answer a question on how to reduce churn on customers leaving? The data comprises demographics, subscription details, number of support calls, website visits, payment history, etc.
We will start with data cleaning and apply Exploratory Data Analysis (EDA) techniques to find the churn rate using bar charts or heat maps. Create new features using feature engineering with Chi-square test and logistic regression Coefficients.
Provide feature-important insights using predictive modeling and the random forest method to achieve a high accuracy model. Provide better recommendations using Prescriptive analytics with Python frameworks. Provide a detailed outcome based on the data analysis.
Learn Data Analytics with PW Skills
Enroll in our Data Analytics Course and master data analytics tools and technologies. Leverage Generative AI models to create more enhanced models, generate information, and advanced analytics. Master Python, SQL Queries, Pandas, Machine Learning, Matplotlib, and other important tools within this course.
Data Analysis and Techniques FAQs
Q1. What is Data Analysis?
Ans: Data analysis is a method used to extract crucial informations from data which is used to make important decision making and conclusions.
Q2. What are the common Data Analysis and techniques?
Ans: The common techniques used in data analysis are data visualisation, statistical analysis, machine learning techniques, time series analysis, data cleaning, correlation, exploratory data analysis, predictive analysis, and more.
Q3. Give one example of data analysis and techniques?
Ans: Stock price analysis, Sentiment analysis of customer reviews, Recommending optimal inventory levels based on demand predictions are some of the examples of data analysis and techniques.
Q4. What is a predictive analysis technique?
Ans: Predictive Analysis employs machine learning or statistical methods to predict future trends. It can forecast future outcomes based on the statistics and modeling techniques.

