Dashboards BI or BI Dashboards are business intelligence tools used to make informed data decisions and drive an organization towards its goal. It is used in multiple sources such as marketing, sales, finance, IT, etc.
Dashboards BI is used to monitor the performance of the business, track customer satisfaction, discover business opportunities, identify trends, and more. Managing data is important, and this is where we need Dashboards BI to help us with. In this article, we will learn how to use Dashboards and their uses and benefits.
Dashboards BI: What is a Business Intelligence Dashboard?
The Dashboards BI can easily integrate with various types of data sources and conduct quick data analysis to gather useful insights and create data visualization like charts, graphs, etc on the dashboard easily.
A BI Dashboard is a business intelligence tool that helps users track and analyze major key performance indicators. They can also make reports and visualize data using charts, graphs, and other methods. The visual information is used to share and collaborate with the shareholders.
Also, check the Difference Between Business Intelligence Programs and Data Analytics in business
Why use Dashboards BI in Business?
The BI dashboards are used to provide key information about the data from various sources. For instance, have you seen a card dashboard or bike dashboard in front? What is their use? Why are they placed in that position? Well, these dashboards provide important information about the fuel level, speed, temperature, brakes, and other essential metrics about the vehicle.
Similarly, bi dashboards provide important information about the data from various sources in a business. Data coming from various sources, such as sales, marketing, finance, and operations is represented in a visual format especially for the stakeholders to understand. BI dashboards hold important information like Key Performance Indicators (KPIs), data points, and other metrics.
Features of Dashboards BI and Components
There are various use cases of BI dashboards used to analyse and visualize data for an organization or stakeholder in an easy-to-understand format. Dashboards BI presents a complete view of business metrics used to analyze market trends, analysis, and decision-making.
- Flexible Interface: The Dashboards BI interface allows users to customize the dashboard component as per their needs. It creates more interactive reports that are easy enough for readers to understand data for further analysis.
- Standard Templates: BI dashboards contain built-in templates to speed up a visualization in real time. This speeds up the process by a significant amount.
- Integration with Data Sources: BI dashboards can connect to various sources, data lakes, operating systems, warehouses, etc to integrate and customize data from various sources.
- Data Visualisation: It is the most important feature of dashboards BI which is used to present data in an interactive format such as charts, graphs, and other formats.
- Data Filters: You can apply various filters to your data based on your preferences. Customize the geographical settings, time, place, and much more using data filters.
- Easy to share: BI dashboards allow to share data results easily after analysis to stakeholders and other companies without any additional components from third party sources.
Also, check, Top 15 Business Intelligence Tools for 2024
Who can Operate Dashboards BI?
The Business Intelligence Tool can be operated by experts with the expertise of Data Analytics and knowledge of related terms.
Business Analysts are professionals who use dashboards BI to interpret data and extract important data for decision making. Data Analysts are professionals with knowledge of data analysis, data visualization, and everything related to data. They can easily handle dashboards bI tool.
However, business intelligence tools are also used and handled by IT professionals, marketing, sales, and other teams to integrate databases, track performance, and other important decision making for organizations. Small Scale business owners use it to produce a high level visualization of the performance metrics.
Skills Required to Operate Dashboards BI Tool
You will require a handful of skills to operate bi dashboard tools in your organizations. However, it is important for analysts and other professionals to know about this important visualization tool.
- Data Analysis Skills: Efficient in data structures, data, relationships, and trends and can use data analysis tools to extract useful information from a heap of data easily.
- Knowledge of BI Tools: You must be aware of other important business intelligence tools such as Power BI, Tableau, Quill, etc. Learn to use pre built templates using these templates.
- Familiar with Data Visualisation: Being aware of data visualization tools to create clear, and effective graphs, charts and tables to represent data in an understandable format.
- Database Manipulation: Knowledge of basic database management, SQL queries, and ETL processes.
- Technical Skills: Knowledge of Programming languages, advanced analytics, database manipulations, and APIs for integrating various data sources from different fields.
Recommended Course
Benefits of Using Dashboards BI In Data Analytics
BI dashboards are used for various purposes in a business in order to generate useful customer information, filter data, create visualization, and more. People with no-technical knowledge can also interact with bi dashboards to some level.
- Identify Trends: BI dashboards provide organizations with the power to find trends in the market and filter them as per the priorities of the business. It also offers predictive insights into the business.
- Interactive Visualisation: In order to create a better and more understandable interface, experts use these dashboards to present the information to stakeholders in an easily understandable format.
- Forecasting: With effective data analysis the collected information on the BI dashboards can be used to make accurate forecasting using predictive analytics models.
- Real time insights: Make accurate decisions with data from various sources that provide real time data. You can easily drag and drop data from various sources without manually checking the whole database.
- Flexibility: You can easily customize the dashboards as per your needs. The dashboard is accessible 24×7 on all other cross-platform devices.
BI Dashboards Vs Reports: What is the Difference?
The major differences between dashboards BI and reports are mentioned in the table below.
| BI Dashboards | BI Reports |
| It is usually displayed on a single page | It is used on one or more pages |
| Data is collected and displayed using multiple data sources | A single dataset per report can be made. |
| It offers real time insights and Key Performance Indicators (KPIs) | It provides a detailed and in-depth analysis of any data. |
| It is used to monitor and track ongoing business activities | It is used for detailed analysis, historical tracking, and reporting purposes. |
| It is a highly interactive information | It offers static and limited interaction |
| The audience is executives, managers, and other operational teams | Business analysts, data scientists, and other department heads. |
| It is used for performance tracking and other operational decisions | It is used for depth analysis or compliance reports |
| Highly customizable format with real time adjustments. | Fixed format or predefined analysis |
How to Create BI Dashboards?
The BI Dashboard can easily be created for various industries such as.
-
- Identify the data metrics: Find your business goal and collect valuable data insights you want to track on your dashboard.
- Collect Data: Get all possible information from various sources including databases, applications, and other platforms.
- Communicate with Stakeholders: Integrate various team members and understand their unique needs. Collect feedback to ensure the dashboard contains all required information.
- BI Dashboard Tools: Choose a BI Dashboard tool based on its features, use, and scalability. Know your organisation’s technical requirements and capabilities and choose a tool accordingly.
- Clean the Data: The data collected must be cleaned and processed for data analytics operations. Clean the data, transform data, and remove inconsistencies and duplicates from the data insights.
- Data Visualization: After preprocessing the data from various sources visualize data with appropriate charts, graphs, maps, and other elements to help stakeholders interpret the data.
Business Intelligence (BI) Dashboard Examples
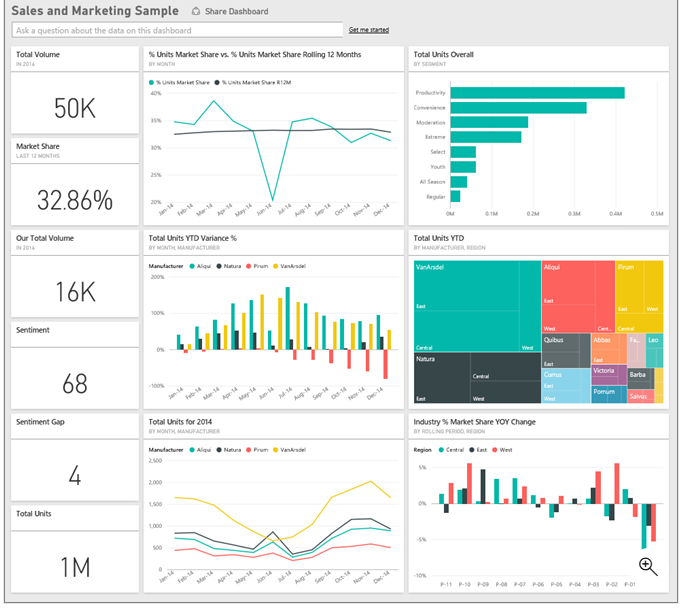
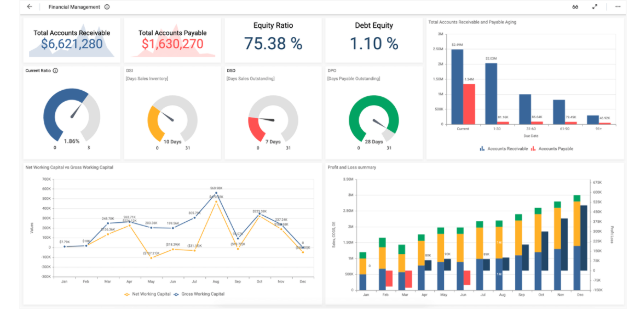
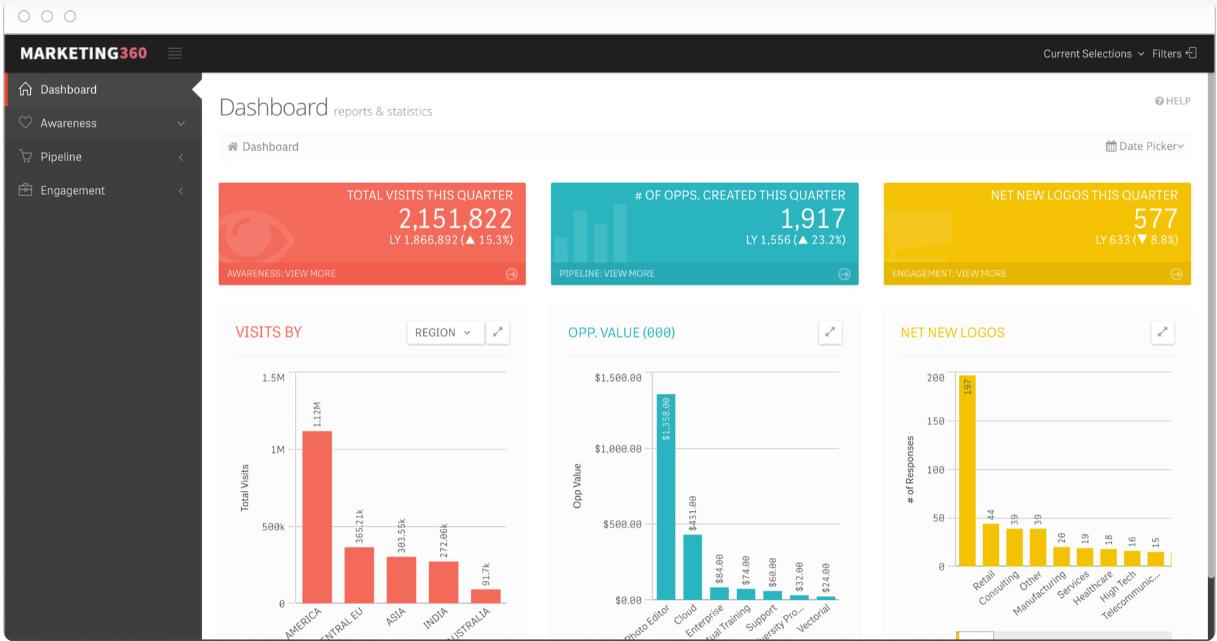
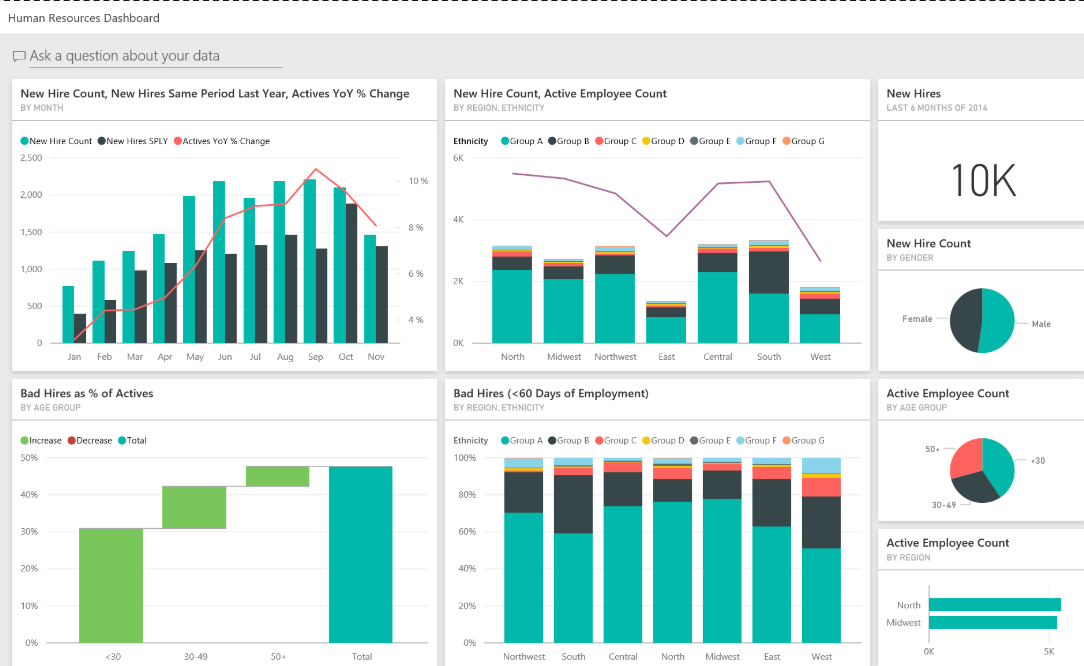
There are many types of BI Dashboard examples from various fields listed below. Check some of the examples.
Sales Dashboard

Finance BI Dashboards

Marketing BI Dashboards

Human Resource Dashboards BI

Master Data Analytics with PW Skills
Become a master in handling data with PW Skills 6 Months Data Analytics Course for beginners as well as working professionals. Learn powerful tools like Python, MySQL, Power BI, AWS, Jupyter, etc from industry experts.
Gain knowledge of Machine Learning, excel, statistics, and more within this course. Work on diverse project portfolios, practice exercises, and module level assignments with this course.
Dashboards BI FAQs
Q1. What are BI Dashboards?
Ans: The Dashboards BI can easily integrate with various types of data sources and conduct quick data analysis to gather useful insights and create data visualization like charts, graphs, etc on the dashboard easily.
Q2. What is the objective of BI Dashboards?
Ans: BI Dashboards are used to collect and interpret data from various sources which can be used to present real time data insights and help businesses make informed decisions. They are used to monitor sales data, trends and other metrics.
Q3. What is the use of BI Dashboards?
Ans: BI Dashboards are used for designing visuals graphics, charts, and other important metrics like finding trends, useful insights from various data sources.
Q4. What are the different types of dashboards in BI?
Ans: There are many BI dashboards which can be used across multiple fields such as sales dashboards, marketing dashboards, finance dashboards, human resource dashboards, helpdesk dashboards, etc.

